

Multivariate pattern analysis reveals subtle brain anomalies relevant to the cognitive phenotype in neurofibromatosis type 1
- PMID: 22965669
- PMCID: PMC6869472
- DOI: 10.1002/hbm.22161
Multivariate pattern analysis reveals subtle brain anomalies relevant to the cognitive phenotype in neurofibromatosis type 1
Abstract
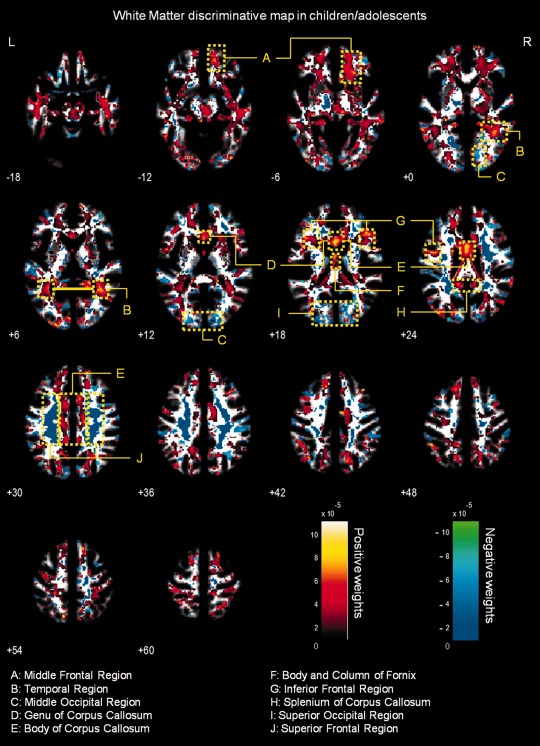
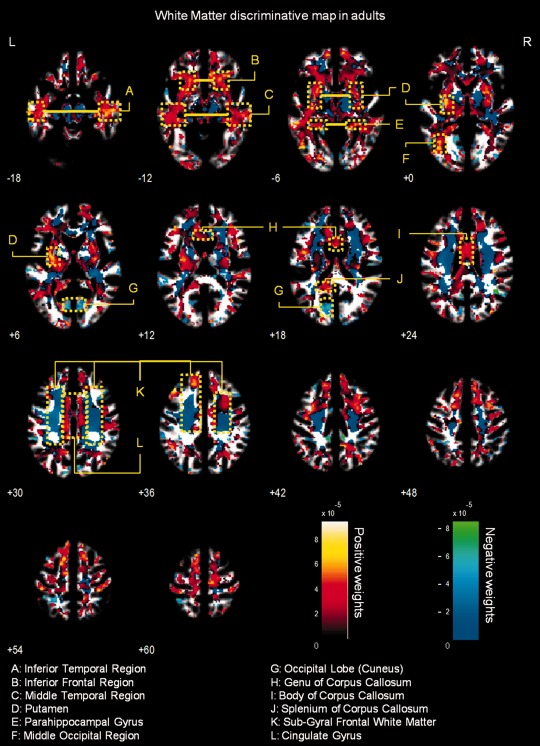
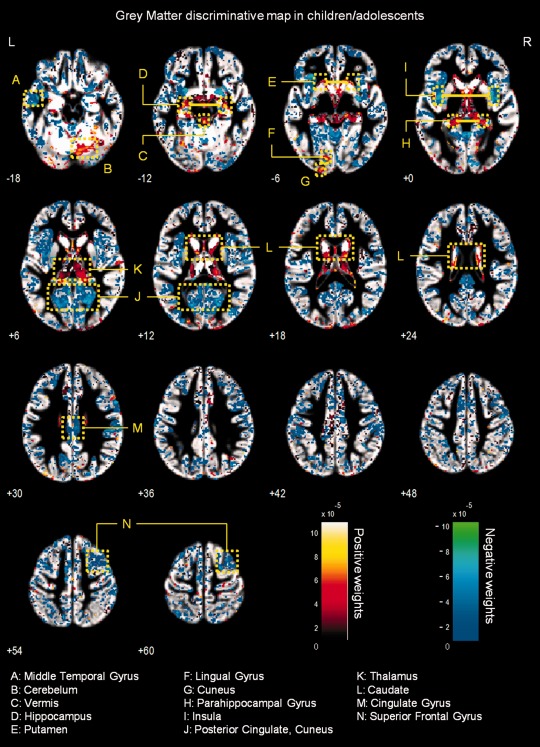
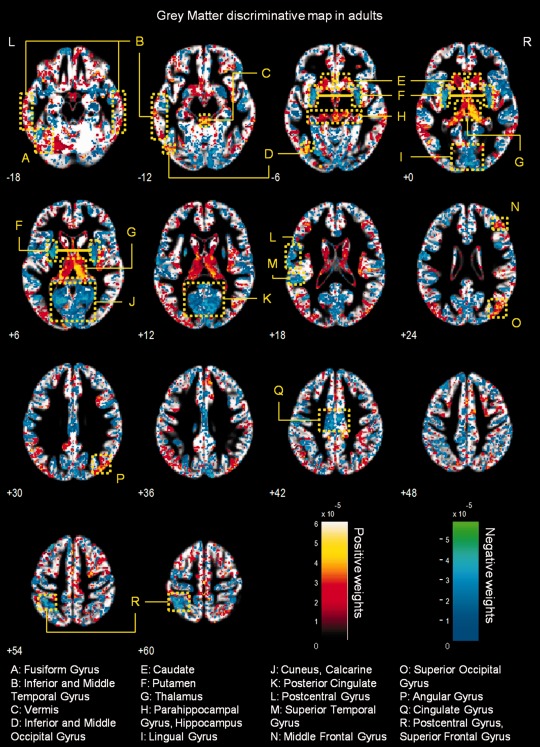
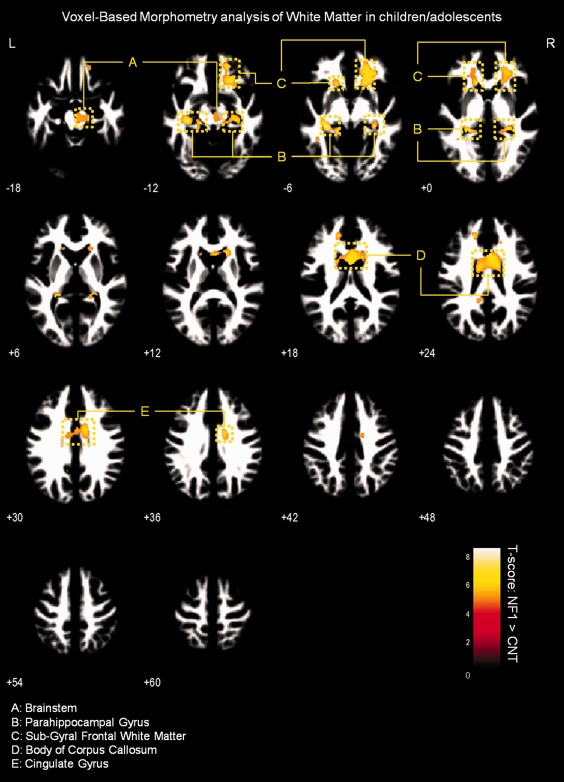
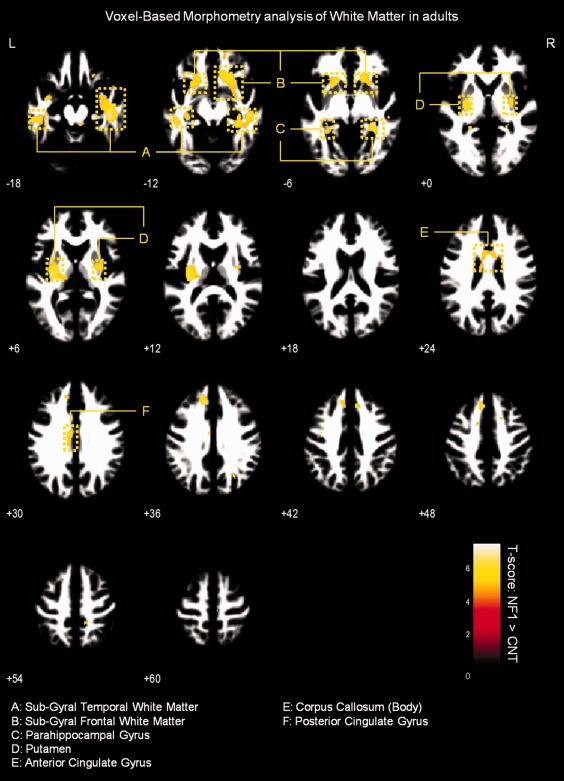
Neurofibromatosis Type 1 (NF1) is a common genetic condition associated with cognitive dysfunction. However, the pathophysiology of the NF1 cognitive deficits is not well understood. Abnormal brain structure, including increased total brain volume, white matter (WM) and grey matter (GM) abnormalities have been reported in the NF1 brain. These previous studies employed univariate model-driven methods preventing detection of subtle and spatially distributed differences in brain anatomy. Multivariate pattern analysis allows the combination of information from multiple spatial locations yielding a discriminative power beyond that of single voxels. Here we investigated for the first time subtle anomalies in the NF1 brain, using a multivariate data-driven classification approach. We used support vector machines (SVM) to classify whole-brain GM and WM segments of structural T1 -weighted MRI scans from 39 participants with NF1 and 60 non-affected individuals, divided in children/adolescents and adults groups. We also employed voxel-based morphometry (VBM) as a univariate gold standard to study brain structural differences. SVM classifiers correctly classified 94% of cases (sensitivity 92%; specificity 96%) revealing the existence of brain structural anomalies that discriminate NF1 individuals from controls. Accordingly, VBM analysis revealed structural differences in agreement with the SVM weight maps representing the most relevant brain regions for group discrimination. These included the hippocampus, basal ganglia, thalamus, and visual cortex. This multivariate data-driven analysis thus identified subtle anomalies in brain structure in the absence of visible pathology. Our results provide further insight into the neuroanatomical correlates of known features of the cognitive phenotype of NF1.
Keywords: MRI; brain structure; multivariate pattern classification; neurofibromatosis type 1; neuroimaging; support vector machine (SVM).
Copyright © 2012 Wiley Periodicals, Inc.
Figures
Similar articles
-
The genetic and neuroanatomical basis of social dysfunction: lessons from neurofibromatosis type 1.Hum Brain Mapp. 2014 May;35(5):2372-82. doi: 10.1002/hbm.22334. Epub 2013 Jul 24. Hum Brain Mapp. 2014. PMID: 23881898 Free PMC article.
-
Are morphological and structural MRI characteristics related to specific cognitive impairments in neurofibromatosis type 1 (NF1) children?Eur J Paediatr Neurol. 2020 Sep;28:89-100. doi: 10.1016/j.ejpn.2020.07.003. Epub 2020 Jul 31. Eur J Paediatr Neurol. 2020. PMID: 32893091
-
Brain morphometry, T2-weighted hyperintensities, and IQ in children with neurofibromatosis type 1.Arch Neurol. 2005 Dec;62(12):1904-8. doi: 10.1001/archneur.62.12.1904. Arch Neurol. 2005. PMID: 16344348
-
Brain structure and function in neurofibromatosis type 1: current concepts and future directions.J Neurol Neurosurg Psychiatry. 2010 Mar;81(3):304-9. doi: 10.1136/jnnp.2009.179630. J Neurol Neurosurg Psychiatry. 2010. PMID: 20185469 Review.
-
Neurocognitive dysfunction in children with neurofibromatosis type 1.Curr Neurol Neurosci Rep. 2003 Mar;3(2):129-36. doi: 10.1007/s11910-003-0064-3. Curr Neurol Neurosci Rep. 2003. PMID: 12583841 Review.
Cited by
-
Oscillatory motor patterning is impaired in neurofibromatosis type 1: a behavioural, EEG and fMRI study.J Neurodev Disord. 2018 Mar 22;10(1):11. doi: 10.1186/s11689-018-9230-4. J Neurodev Disord. 2018. PMID: 29566645 Free PMC article.
-
Classification based hypothesis testing in neuroscience: Below-chance level classification rates and overlooked statistical properties of linear parametric classifiers.Hum Brain Mapp. 2016 May;37(5):1842-55. doi: 10.1002/hbm.23140. Epub 2016 Mar 26. Hum Brain Mapp. 2016. PMID: 27015748 Free PMC article.
-
Social Communication in Ras Pathway Disorders: A Comprehensive Review From Genetics to Behavior in Neurofibromatosis Type 1 and Noonan Syndrome.Biol Psychiatry. 2025 Mar 1;97(5):461-498. doi: 10.1016/j.biopsych.2024.09.019. Epub 2024 Oct 2. Biol Psychiatry. 2025. PMID: 39366539
-
Autism-associated Nf1 deficiency disrupts corticocortical and corticostriatal functional connectivity in human and mouse.Neurobiol Dis. 2019 Oct;130:104479. doi: 10.1016/j.nbd.2019.104479. Epub 2019 May 22. Neurobiol Dis. 2019. PMID: 31128207 Free PMC article.
-
Resting state functional MRI reveals abnormal network connectivity in neurofibromatosis 1.Hum Brain Mapp. 2015 Nov;36(11):4566-81. doi: 10.1002/hbm.22937. Epub 2015 Aug 25. Hum Brain Mapp. 2015. PMID: 26304096 Free PMC article.
References
-
- Ashburner J (2007): A fast diffeomorphic image registration algorithm. NeuroImage 38:95–113. - PubMed
-
- Ashburner J (2009): Computational anatomy with the SPM software. Magn Reson Imaging 27:1163–1174. - PubMed
-
- Ashburner J, Friston KJ (2000): Voxel‐based morphometry—The methods. NeuroImage 11:805–821. - PubMed
-
- Ashburner J, Friston KJ (2005): Unified segmentation. NeuroImage 26:839–851. - PubMed
-
- Barbier C, Chabernaud C, Barantin L, Bertrand P, Sembely C, Sirinelli D, Castelnau P, Cottier JP (2011): Proton MR spectroscopic imaging of basal ganglia and thalamus in neurofibromatosis type 1: Correlation with T2 hyperintensities. Neuroradiology 53:141–148. - PubMed
Publication types
MeSH terms
LinkOut - more resources
Full Text Sources
Research Materials
Miscellaneous
