. 2014 Jan;35(1):213-26.
doi: 10.1002/hbm.22172. Epub 2012 Sep 11.

Human finger somatotopy in areas 3b, 1, and 2: a 7T fMRI study using a natural stimulus

Affiliations

Human finger somatotopy in areas 3b, 1, and 2: a 7T fMRI study using a natural stimulus

Roberto Martuzzi et al. Hum Brain Mapp. 2014 Jan.

Abstract

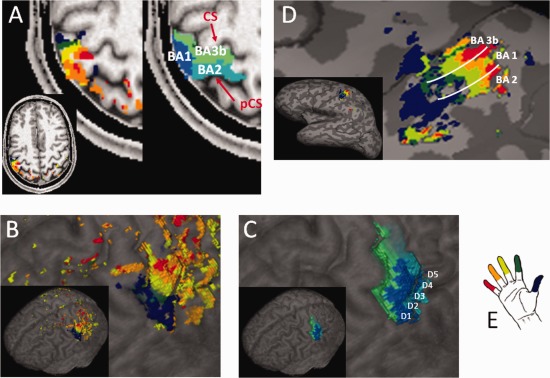
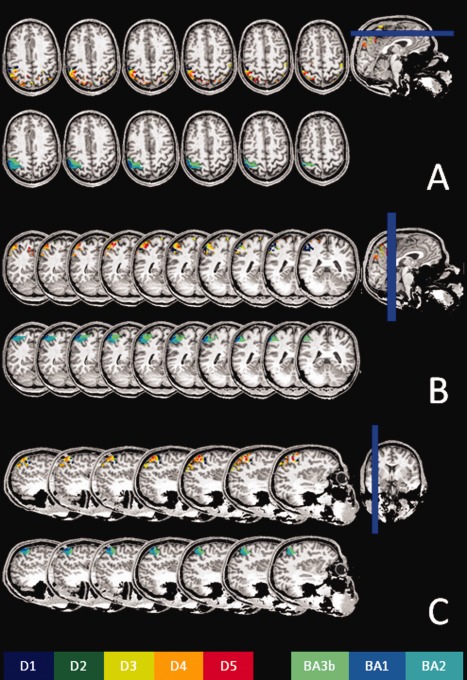
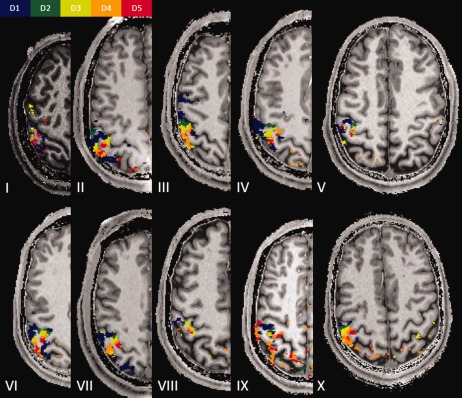
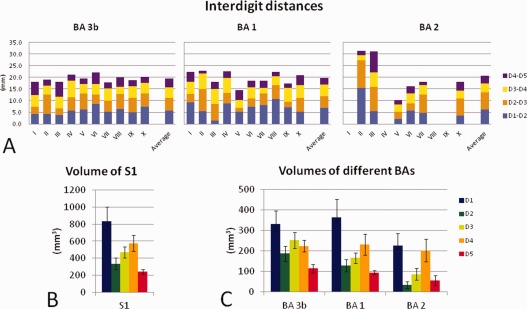
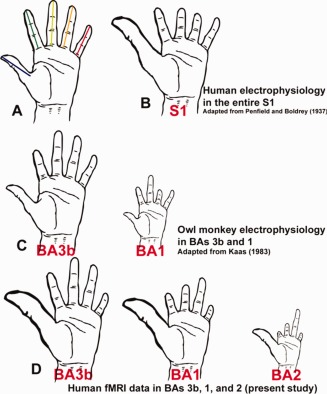
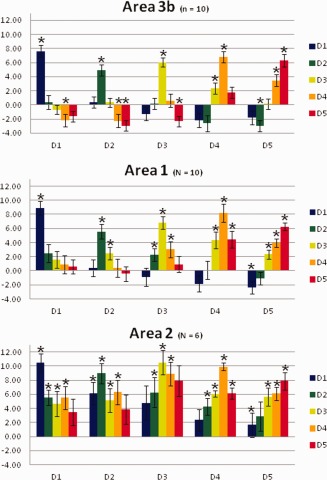
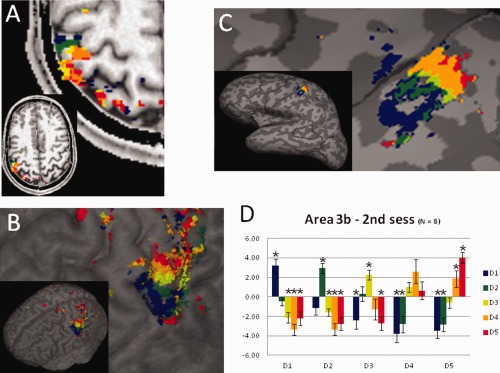
To study the properties of human primary somatosensory (S1) cortex as well as its role in cognitive and social processes, it is necessary to noninvasively localize the cortical representations of the body. Being arguably the most relevant body parts for tactile exploration, cortical representations of fingers are of particular interest. The aim of the present study was to investigate the cortical representation of individual fingers (D1-D5), using human touch as a stimulus. Utilizing the high BOLD sensitivity and spatial resolution at 7T, we found that each finger is represented within three subregions of S1 in the postcentral gyrus. Within each of these three areas, the fingers are sequentially organized (from D1 to D5) in a somatotopic manner. Therefore, these finger representations likely reflect distinct activations of BAs 3b, 1, and 2, similar to those described in electrophysiological work in non-human primates. Quantitative analysis of the local BOLD responses revealed that within BA3b, each finger representation is specific to its own stimulation without any cross-finger responsiveness. This finger response selectivity was less prominent in BA 1 and in BA 2. A test-retest procedure highlighted the reproducibility of the results and the robustness of the method for BA 3b. Finally, the representation of the thumb was enlarged compared to the other fingers within BAs 1 and 2. These findings extend previous human electrophysiological and neuroimaging data but also reveal differences in the functional organization of S1 in human and nonhuman primates.

Keywords: 7 tesla; digit representation; fMRI; somatotopy.


Figures

Figure 1
Figure 1
Results of the finger mapping procedure. The finger maps and BAs of one representative subject are displayed (A) on a selected axial plane, (B) and (C) on the cortical surface, and (D) on the inflated brain (including a schematic representation of the borders between the three BAs). The color code for the fingers is represented in (E), while different tones of blue indicate the three functional subregions. As anatomical references, the central sulcus (CS) and postcentral sulcus (pCS) are indicated on the axial slice.
Figure 2
Figure 2
A set of axial (A), coronal (B), and sagittal (C) slices extracted from the same subject as in Fig. 1, showing the representations of the five fingers and BAs. All slices are displayed relative to the scanner coordinates, and have not been reoriented relative to the bicommissural plane.
Figure 3
Figure 3
Robustness of the mapping procedure. One representative slice for each of the participants in the experiment is displayed, showing the robustness of the mapping procedure as well as the intersubject variability of finger representations.
Figure 4
Figure 4
Quantitative analyses conducted on the finger representations. A: Interdigit distances between adjacent fingers for all subjects and the average across participants for each BA. B: Graphics representing the average volume (with the error bars indicating the standard error of the mean) of each single finger representation within the entire S1. C: The volume of each finger representation within each BA (error bars indicate the standard error). Note the overrepresentation of the thumb region relative to the other fingers.
Figure 5
Figure 5
Schematic representation by different authors of the size of cortical finger representations in different species. The size of the cortical representations of each finger is indicated by the length of that finger. All finger sizes are plotted onto a human hand. A: Human hand. The colored lines represent for each finger the length of the finger that was scaled according to the results from the different studies. B: Single finger representation in human S1 as measured with intraoperative stimulation in humans (Penfield and Boldrey, 1937). C: Single finger representation in owl monkeys for BAs 3b and 1 as measured with electrophysiology (Kaas, 1983). The hand sizes were scaled with the size of BAs 3b and 1 reported in the paper. D: Single finger representation in human BAs 3b, 1, and 2 as measured with fMRI in the present study. The hand sizes were scaled with the size of BAs 3b, 1 and 2 measured in this study.
Figure 6
Figure 6
Average BOLD response (beta values) to finger stimulation within each finger representation within the three BAs. Asterisks indicate values significantly different from zero (P < 0.05). Error bars show the standard error.
Figure 7
Figure 7
Reproducibility of the mapping procedure. Finger mapping obtained during the second session in the same subject shown in Fig. 1A shown on (A) a selected axial plane, on (B) the cortical surface, and on (C) the inflated brain, using the same color code as in Fig. 1. D: Average beta values (error bars indicate the standard error) obtained during the second session within BA 3b defined using the results of the first session. Asterisks indicate values significantly different from zero (P < 0.05).

References

    1. Blakemore SJ, Wolpert DM, Frith CD (1998): Central cancellation of self‐produced tickle sensation. Nat Neurosci 1:635–640. - PubMed
    1. Blanke O, Morand S, Thut G, Michel CM, Spinelli L, Landis T, Seeck M (1999): Visual activity in the human frontal eye field. Neuroreport 10:925–930. - PubMed
    1. Blanke O, Perrig S, Thut G, Landis T, Seeck M (2000): Simple and complex vestibular responses induced by electrical cortical stimulation of the parietal cortex in humans. J Neurol Neurosurg Psychiatry 69:553–556. - PMC - PubMed
    1. Cardini F, Costantini M, Galati G, Romani GL, Ladavas E, Serino A (2011): Viewing one's own face being touched modulates tactile perception: an fMRI study. J Cogn Neurosci 23:503–513. - PubMed
    1. Costanzo RM, Gardner EP (1980): A quantitative analysis of responses of direction‐sensitive neurons in somatosensory cortex of awake monkeys. J Neurophysiol 43:1319–1341. - PubMed

Publication types