

Factors that affect deceased donor liver transplantation rates in the United States in addition to the Model for End-stage Liver Disease score
- PMID: 22965903
- PMCID: PMC3518743
- DOI: 10.1002/lt.23548
Factors that affect deceased donor liver transplantation rates in the United States in addition to the Model for End-stage Liver Disease score
Abstract
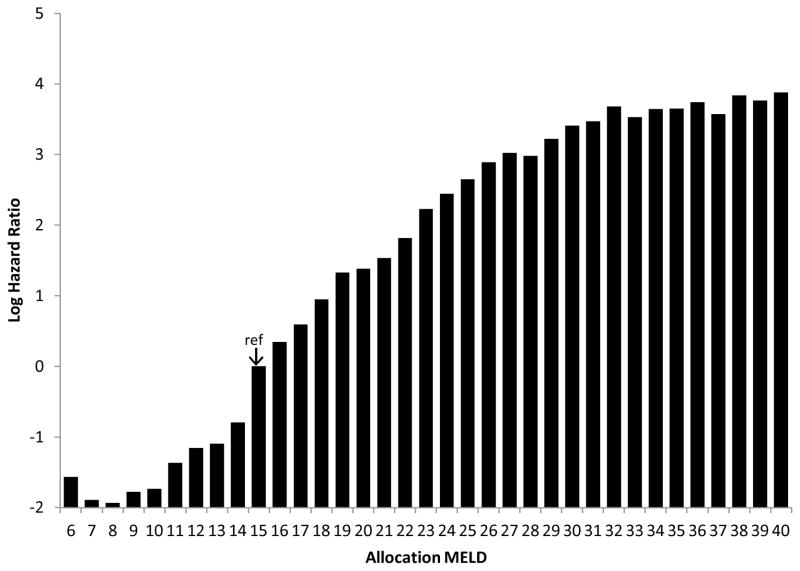
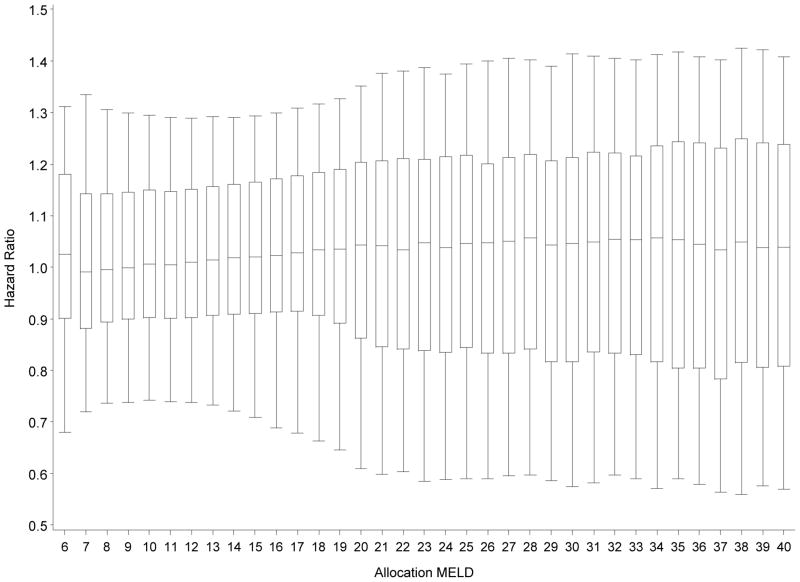
Under an ideal implementation of Model for End-Stage Liver Disease (MELD)-based liver allocation, the only factors that would predict deceased donor liver transplantation (DDLT) rates would be the MELD score, blood type, and donation service area (DSA). We aimed to determine whether additional factors are associated with DDLT rates in actual practice. Data from the Scientific Registry of Transplant Recipients for all adult candidates wait-listed between March 1, 2002 and December 31, 2008 (n = 57,503) were analyzed. Status 1 candidates were excluded. Cox regression was used to model covariate-adjusted DDLT rates, which were stratified by the DSA, blood type, liver-intestine policy, and allocation MELD score. Inactive time on the wait list was not modeled, so the computed DDLT hazard ratios (HRs) were interpreted as active wait-list candidates. Many factors, including the candidate's age, sex, diagnosis, hospitalization status, and height, prior DDLT, and combined listing for liver-kidney or liver-intestine transplantation, were significantly associated with DDLT rates. Factors associated with significantly lower covariate-adjusted DDLT rates were a higher serum creatinine level (HR = 0.92, P < 0.001), a higher bilirubin level (HR = 0.99, P = 0.001), and the receipt of dialysis (HR = 0.83, P < 0.001). Mild ascites (HR = 1.15, P < 0.001) and hepatic encephalopathy (grade 1 or 2, HR = 1.05, P = 0.02; grade 3 or 4, HR = 1.10, P = 0.01) were associated with significantly higher adjusted DDLT rates. In conclusion, adjusted DDLT rates for actively listed candidates are affected by many factors aside from those integral to the allocation system; these factors include the components of the MELD score itself as well as candidate factors that were considered but were deliberately omitted from the MELD score in order to keep it objective. These results raise the question whether additional candidate characteristics should be explicitly incorporated into the prioritization of wait-list candidates because such factors are already systematically affecting DDLT rates under the current allocation system.
Copyright © 2012 American Association for the Study of Liver Diseases.
Figures
Similar articles
-
Racial and ethnic disparities in access to liver transplantation.Liver Transpl. 2010 Sep;16(9):1033-40. doi: 10.1002/lt.22108. Liver Transpl. 2010. PMID: 20818740 Free PMC article.
-
Quantifying Sex-Based Disparities in Liver Allocation.JAMA Surg. 2020 Jul 1;155(7):e201129. doi: 10.1001/jamasurg.2020.1129. Epub 2020 Jul 15. JAMA Surg. 2020. PMID: 32432699 Free PMC article.
-
Outcomes for liver transplant candidates listed with low model for end-stage liver disease score.Liver Transpl. 2015 Nov;21(11):1403-9. doi: 10.1002/lt.24307. Liver Transpl. 2015. PMID: 26289624 Free PMC article.
-
Model for end-stage liver disease exceptions in the context of the French model for end-stage liver disease score-based liver allocation system.Liver Transpl. 2011 Oct;17(10):1137-51. doi: 10.1002/lt.22363. Liver Transpl. 2011. PMID: 21695771 Review.
-
Development of the allocation system for deceased donor liver transplantation.Clin Med Res. 2005 May;3(2):87-92. doi: 10.3121/cmr.3.2.87. Clin Med Res. 2005. PMID: 16012126 Free PMC article. Review.
Cited by
-
Outcomes of liver transplantation for porto-pulmonary hypertension in model for end-stage liver disease era.Dig Dis Sci. 2014 Aug;59(8):1976-82. doi: 10.1007/s10620-014-3065-y. Epub 2014 Feb 21. Dig Dis Sci. 2014. PMID: 24557576 Free PMC article.
-
Outcomes in liver transplantation: does sex matter?J Hepatol. 2015 Apr;62(4):946-55. doi: 10.1016/j.jhep.2014.11.023. Epub 2014 Nov 27. J Hepatol. 2015. PMID: 25433162 Free PMC article. Review.
-
Women who undergo liver transplant have longer length of stay post-transplant compared with men.Liver Int. 2020 Jul;40(7):1725-1735. doi: 10.1111/liv.14512. Epub 2020 May 25. Liver Int. 2020. PMID: 32412164 Free PMC article.
-
Predicting chance of liver transplantation for pediatric wait-list candidates.Pediatr Transplant. 2019 Nov;23(7):e13542. doi: 10.1111/petr.13542. Epub 2019 Jul 16. Pediatr Transplant. 2019. PMID: 31313464 Free PMC article.
-
Low adipose tissue index as an indicator of hepatic encephalopathy in cirrhotic patients following transjugular intrahepatic portosystemic shunt.Abdom Radiol (NY). 2023 Apr;48(4):1454-1467. doi: 10.1007/s00261-023-03813-4. Epub 2023 Feb 3. Abdom Radiol (NY). 2023. PMID: 36735033
References
-
- UNOS/OPTN. 3.6 Organ Distribution: Allocation of Livers. Policies. 2002 http://www.unos.org/PoliciesandBylaws2/policies/docs/policy_8.doc.
-
- Institute of Medicine; DHHS. Committee on organ transplantation. Assessing current policies and the potential impact of DHHS final rule. Washington DC: National Academy of Press; 1999. Analysis of waiting time; pp. 57–88.
-
- Wiesner RH, McDiarmid SV, Kamath PS, Edwards EB, Malinchoc M, Kremers WK, Krom RA, Kim WR. MELD and PELD: application of survival models to liver allocation. Liver Transpl. 2001;7:567–80. - PubMed
-
- Kamath PS, Wiesner RH, Malinchoc M, Kremers W, Therneau TM, Kosberg CL, D’Amico G, Dickson ER, Kim WR. A model to predict survival in patients with end-stage liver disease. Hepatology. 2001;33:464–70. - PubMed
-
- Wiesner R, Edwards E, Freeman R, Harper A, Kim R, Kamath P, Kremers W, Lake J, Howard T, Merion RM, Wolfe RA, Krom R. Model for end-stage liver disease (MELD) and allocation of donor livers. Gastroenterology. 2003;124:91–6. - PubMed