. 2012 Sep 24;209(10):1723-42, S1.
doi: 10.1084/jem.20120914. Epub 2012 Sep 10.

Neuropilin 1 is expressed on thymus-derived natural regulatory T cells, but not mucosa-generated induced Foxp3+ T reg cells

Affiliations

Neuropilin 1 is expressed on thymus-derived natural regulatory T cells, but not mucosa-generated induced Foxp3+ T reg cells

Jonathan M Weiss et al. J Exp Med. .

Abstract

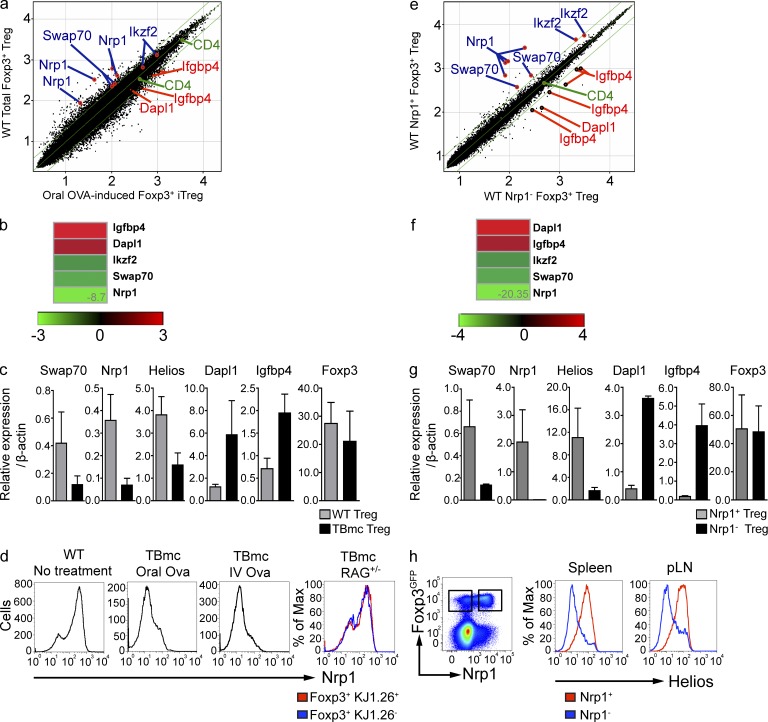
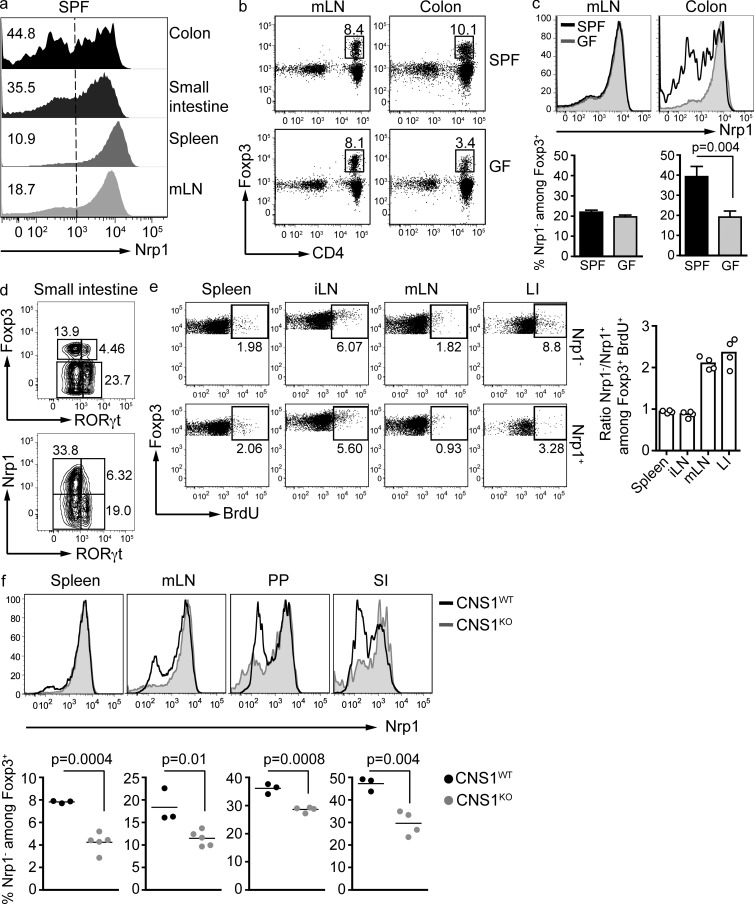
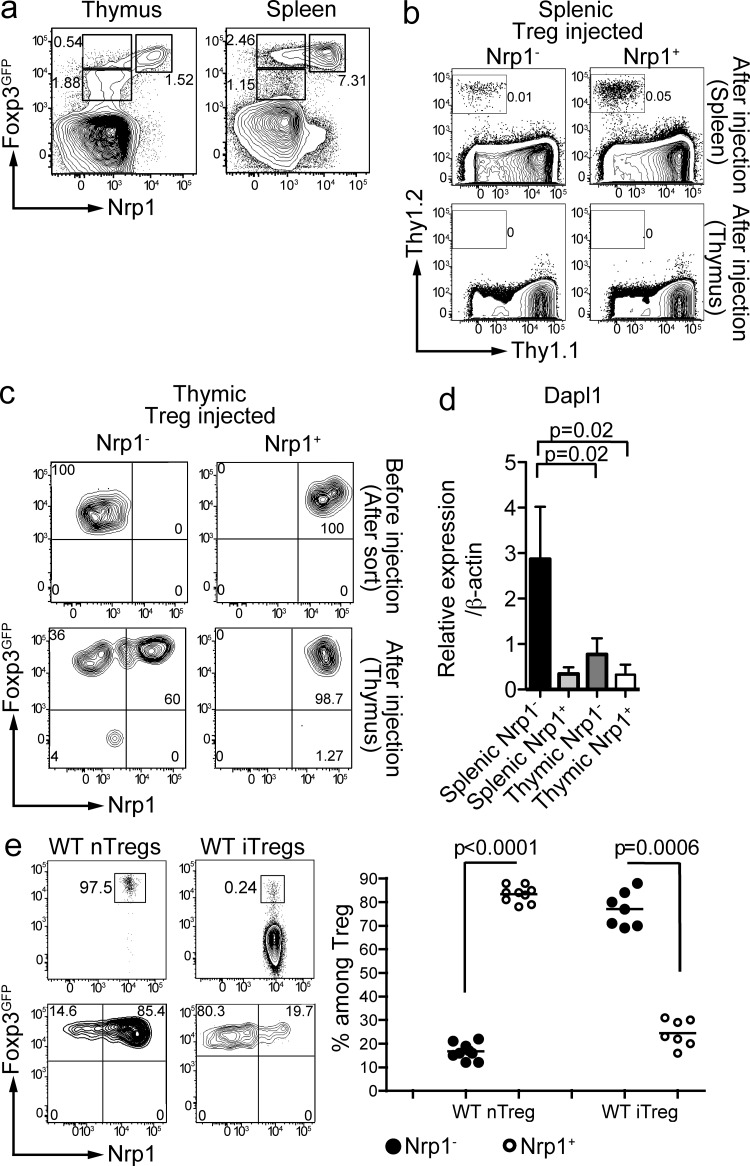
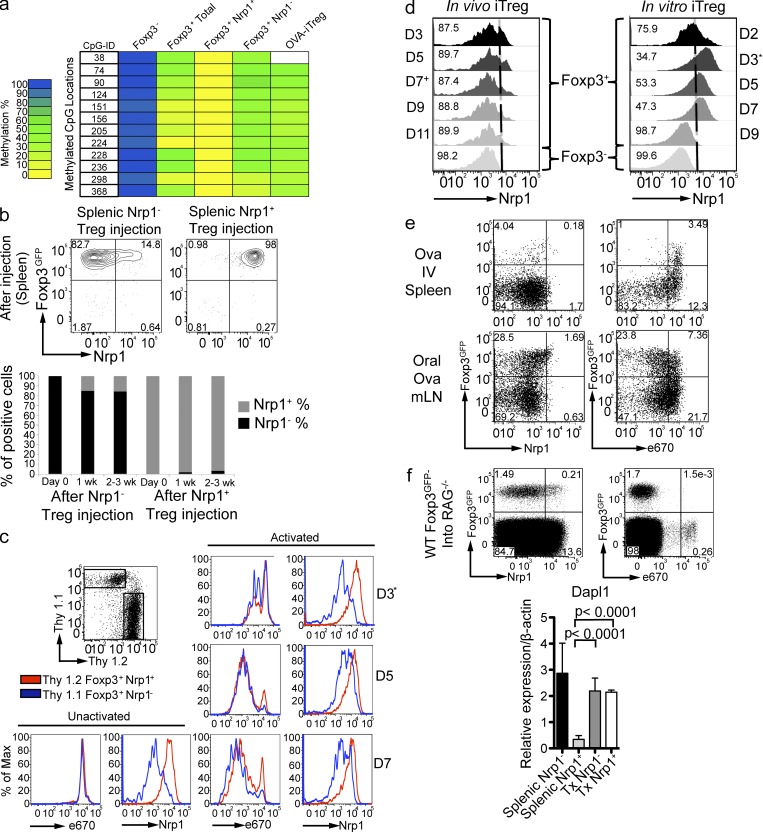
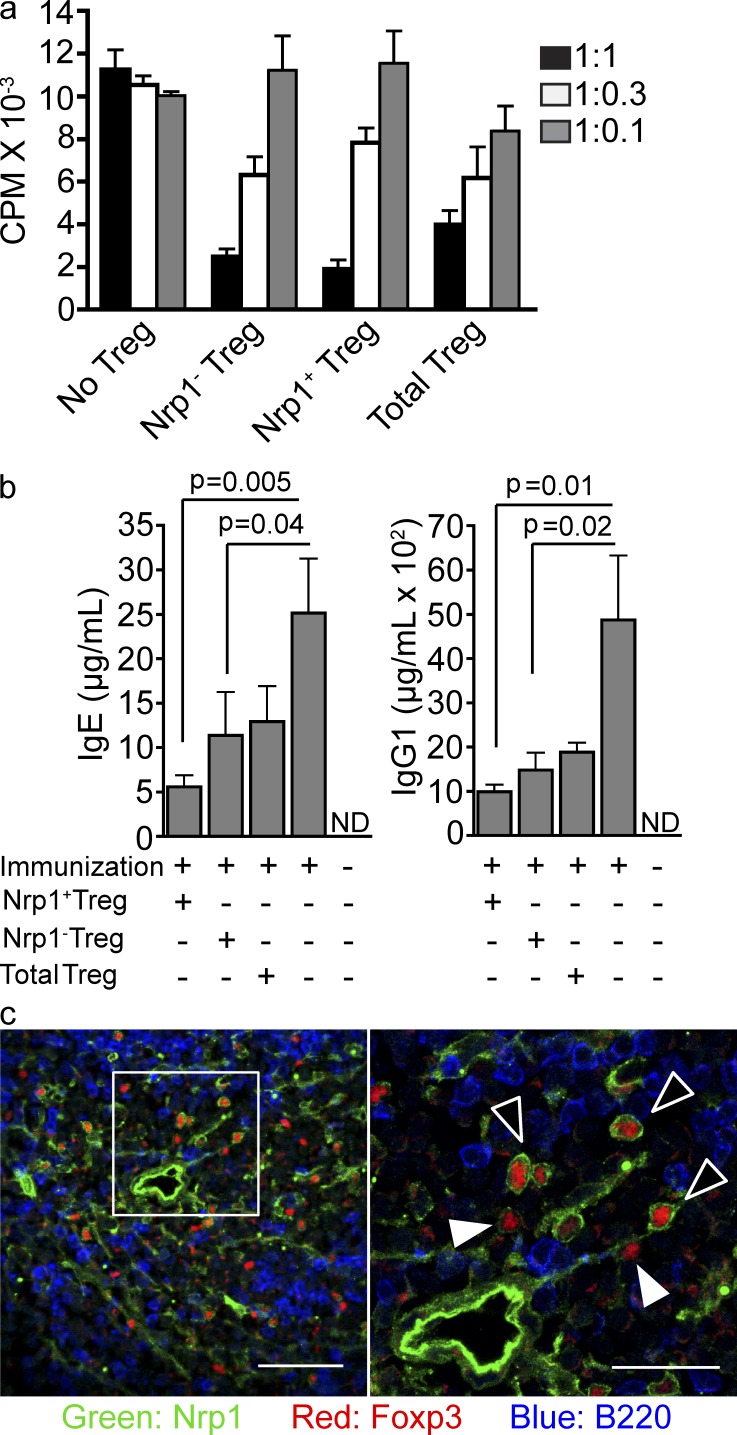
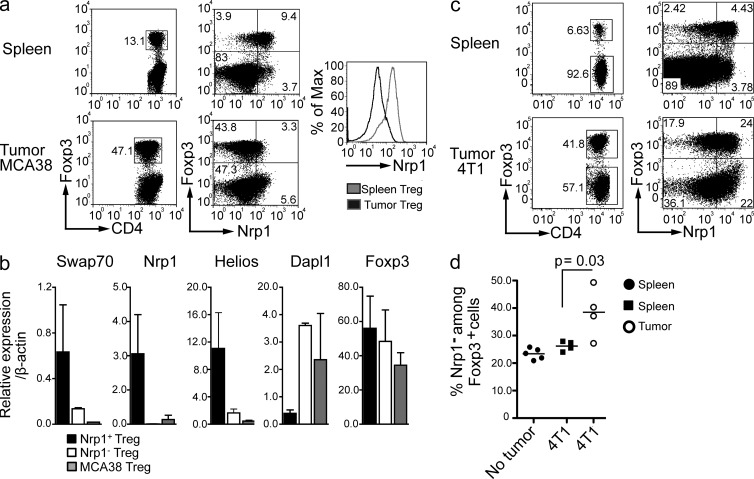
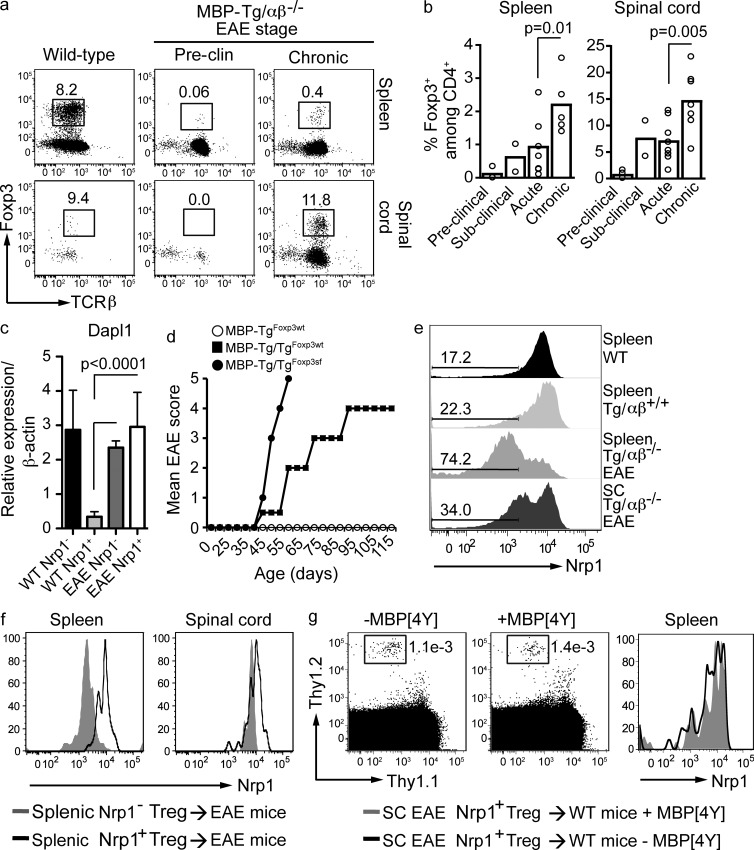
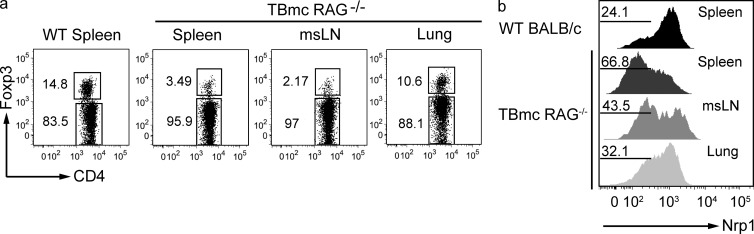
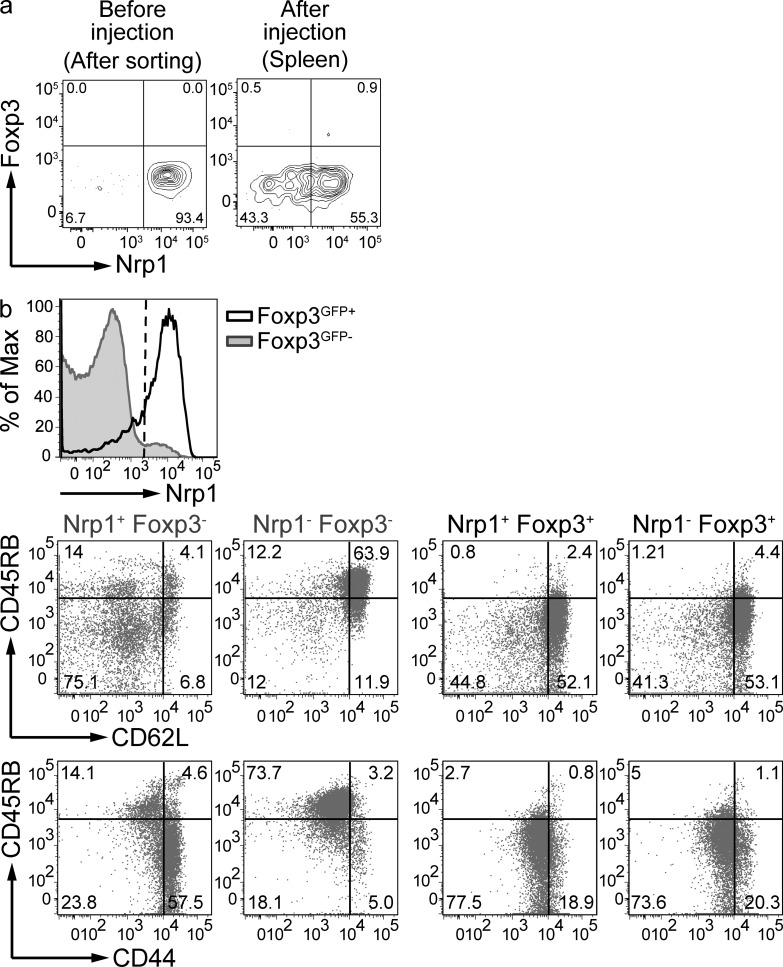
Foxp3 activity is essential for the normal function of the immune system. Two types of regulatory T (T reg) cells express Foxp3, thymus-generated natural T reg (nT reg) cells, and peripherally generated adaptive T reg (iT reg) cells. These cell types have complementary functions. Until now, it has not been possible to distinguish iT reg from nT reg cells in vivo based solely on surface markers. We report here that Neuropilin 1 (Nrp1) is expressed at high levels by most nT reg cells; in contrast, mucosa-generated iT reg and other noninflammatory iT reg cells express low levels of Nrp1. We found that Nrp1 expression is under the control of TGF-β. By tracing nT reg and iT reg cells, we could establish that some tumors have a very large proportion of infiltrating iT reg cells. iT reg cells obtained from highly inflammatory environments, such as the spinal cords of mice with spontaneous autoimmune encephalomyelitis (EAE) and the lungs of mice with chronic asthma, express Nrp1. In the same animals, iT reg cells in secondary lymphoid organs remain Nrp1(low). We also determined that, in spontaneous EAE, iT reg cells help to establish a chronic phase of the disease.


Figures

Figure 1.
Figure 1.
Lack of Nrp1 surface expression characterizes iT reg cells generated in vivo by mucosal or intravenous route. (a) Log10 raw expression plots showing differences in gene expression between CD4+ Foxp3GFP+ cells sorted from mLN of BALB/c or OVA-fed TBmc mice. Green diagonal lines indicate twofold expression difference between datasets. Selected genes are indicated in blue (up in WT T reg) or in red (up in TBmc T reg). Data are the average of 3 experiments, each corresponding to a pool of mLN of 15–20 mice per condition. (b) Heat maps showing fold difference of selected genes in panel a. (c) Real-time PCR analysis comparing mRNA level expression of selected genes between total T reg from WT mice and iT reg cells from OVA-fed TBmc mice. Dapl1, P = 0.0022; Nrp1, P = 0.0022; Helios, P = 0.0043; Swap70, P = 0.0043; Igfbp4, P = 0.0022; Foxp3, P = 1.0; nonparametric Mann-Whitney U test. Graph contains results from three biological replicates (two independent experiments). (d) Flow cytometric analysis of Nrp1 expression by CD4+ Foxp3+ T reg cells from WT BALB/c and TBmc mice after OVA treatment by the indicated routes. Histograms are representative of at least five different spleens (WT and TBmc mice injected i.v. with OVA) or mLNs of TBmc mice treated orally with OVA and TBmc RAG+ mice gated on KJ1.26-positive and -negative T reg cells. (e) Log10 raw expression plots showing differences in gene expression between CD4+ Foxp3GFP+ Nrp1+ or Nrp1 cells sorted from spleens of BALB/c mice. Green diagonal lines indicate twofold expression difference between datasets. Selected genes are indicated in blue (up in Nrp1+ T reg) or in red (up in Nrp1 T reg). Data are the average of 2 experiments, each corresponding to a pool of 6–13 spleens per condition. (f) Heat maps showing fold difference of selected genes in e. (g) Real-time PCR analysis of mRNA level expression of genes selected in e. The graph shows the results from five biological replicates (run in duplicate). Dapl1, P = 0.0021; Nrp1, P = 0.0079; Helios, P = 0.0159; Swap70, P = 0.0079; Igfbp4, P = 0.0079; Foxp3, P = 0.6857; nonparametric Mann-Whitney U test. (h) Flow cytometric analysis of Nrp1 and Helios expression by WT spleen and peripheral LNs (pLN). Data are representative of at least five different mice.
Figure 2.
Figure 2.
The intestinal lamina propria harbors Nrp1 iT reg cells in high proportions, which is partly dependent on the microbiota. (a) Flow cytometric analysis of Nrp1 expression by CD4+ Foxp3+ T reg present in the indicated organs of SPF mice. Histograms are representative of at least five different mice. Numbers on the left indicate the percentage of Nrp1 cells among Foxp3+ CD4+ cells. Vertical dashed line indicates the negative and positive populations. LI, large intestine; SI, small intestine. (b) Frequency of Foxp3+ cells within the CD4+ cell population isolated from mLNs or large intestines lamina propria (LP) of SPF and germ-free mice. FACS plots are gated on CD45high TCRβ+. Dot plots are representative of three SPF and three germ-free mice (two independent experiments). (c) Analysis of Nrp1 expression by CD4+ Foxp3+ T reg cells from mLNs and LI of SPF and germ-free Swiss-Webster mice (same mice as in b). (d) Analysis of RORγt and Nrp1 expression by Foxp3+ T reg cells present in the small intestine LP of SPF mice. FACS plots are gated on CD4+ TCRβ+ (top FACS plot) and CD4+ TCRβ+ Foxp3+ (bottom FACS plot). Data are representative of two independent experiments (n = 3 mice/group). (e) BrdU incorporation by Nrp1+ and Nrp1 T reg cells 4 h after BrdU injection. FACS plots are gated on CD4+ CD45+ Foxp3+, and each plot shows 50,000 events. Plots are representative of two independent experiments (n = 2 mice/group). Graph shows the data of the two experiments. (f) Nrp1 expression by CD4+ Foxp3+ T reg cells extracted from the indicated organs of CNS1-deficient mice compared with WT littermates. PP, Peyer’s patches. Data are representative of two independent experiments (n = 3–5 mice/group). Significance was determined by unpaired Student’s t test.
Figure 3.
Figure 3.
A population of Nrp1 Foxp3high cells is absent in WT thymus. (a) Phenotype of CD4 single-positive T cells in the thymus and the spleen of Foxp3GFP mice. Gates show the percentage of Nrp1 (Foxp3low in the thymus; left), Foxp3high in the spleen (right) and Nrp1+ T reg cells. Dot plots are representative of at least five mice. (b) 1–2 × 10⁵ Thy1.2+ Nrp1 (left) or Nrp1+ (right) spleen T reg cells were injected i.v. into Thy1.1+ recipient mice, and their recovery was analyzed in the spleen (top) or thymus (bottom) 1 or 2 wk later by flow cytometry (FACS plots show CD4+ cells). Dot plots are representative of 4 different experiments (n = 2 mice/group); a 2-wk time-point experiment is shown. (c) Sorted thymic Thy1.2+ Nrp1 (left) or Nrp1+ (right) T reg cells were intrathymically injected and thymi were analyzed 4 d later. FACS plots are gated on CD4+ Thy1.2+ Thy1.1 cells. Data are representative of 2 independent experiments (n = 2 mice/group). (d) qPCR analysis of Dapl1 expression by sorted thymic and splenic T reg populations (n = 3 biological samples run in duplicate). P-values were calculated with nonparametric Mann-Whitney U test. (e; top) Thy1.2+ total thymic CD4 SP Foxp3+ T cells (referred to as WT nT reg) were intrathymically injected, whereas splenic Foxp3 T cells were injected i.v. (referred to as WT iT reg) into congenic hosts. 2 wk later, pooled spleen and LNs were analyzed for Foxp3 and Nrp1 expression on transferred cells. FACS plots are gated on CD4+ Thy1.2+ Thy1.1 cells (top dot plots); bottom plots show the aforementioned Foxp3+ gate. Data are the result of 3 independent experiments for the nT reg group (n = 2–4 mice/experiment) and 3 experiments for the iT reg group (n = 2–3 mice/experiment). Unpaired Student’s t test was used to determine significance.
Figure 4.
Figure 4.
Both Foxp3+Nrp1+ nT reg cells and Foxp3+Nrp1 iT reg cells are stable cell populations in the steady state in vivo. (a) The indicated cell populations were sorted from spleens of BALB/c Foxp3GFP or TBmc Foxp3GFP mice. Each lane represents a pool of 3–5 mice (2 independent experiments). OVA-iT reg cells were generated by oral OVA treatment for 1 wk, and T reg cells were sorted 2 wk later. Methylation analysis of the T reg–specific demethylation region (TSDR) was performed by bisulfite sequencing. Color indicates methylation percentage of each CpG island in the TSDR. Actual percentages are shown in Table S1. (b) Splenic Thy1.2+ Nrp1 (left) or Nrp1+ (right) T reg cells were injected i.v., and spleens were analyzed at the indicated time points. FACS plots are gated on CD4+ Thy1.2+ Thy1.1 cells. Shown in graph are the frequencies of Nrp1 or Nrp1+ cells among transferred Foxp3+ cells. Dot plots are representative of 2 experiments (n = 2 mice/group). (c) Stability of Nrp1 expression by T reg cells. Thy 1.2+ Nrp1+ and Thy 1.1+ Nrp1 T reg cells were FACS sorted, labeled with 2.5 µM of eFluor 670, and co-cultured with plate-bound anti-CD3, anti-CD28, and IL-2. On day 3, cells were transferred to new wells with no plate-bound antibody, but containing IL-2 and analyzed at the indicated time points. All plots are gated on CD4+ cells. Histograms are representative of two independent experiments run in duplicate with similar results. (d) Kinetics of Nrp1 expression by in vivo– and in vitro–generated iT reg cells. (right) Sorted naive T cells were cultured with plate-bound anti-CD3 and anti-CD28, IL-2, and active TGF-β. Nrp1 and Foxp3 expression were analyzed at the indicated time points. *, On day 3, cells were transferred to new wells, as in c. Histograms are gated on CD4+ and either Foxp3GFP+ or Foxp3GFP−, as indicated. The experiment was performed twice, in duplicate. (left) In vivo generation of iT reg cells. Thy1.1 recipient mice were transferred with 106 CD4+ Foxp3GFP− cells sorted from TBmc RAG−/−. Left histograms show Nrp1 expression on CD4+ Thy 1.1, Thy 1.2+ Foxp3GFP+ T reg, and Foxp3GFP− cells extracted from mLN at the indicated time points after oral OVA treatment. +On day 7, oral OVA treatment was stopped. Histograms are representative of two independent experiments with n = 2 mice per experiment. (e) Correlation of route of iT reg generation and proliferation. WT mice were transferred with 106 naive D011.10 CD4+ T cells from TBmc Foxp3GFP mice labeled with 5 µM of eFluor 670 and treated with OVA by the indicated routes. Nrp1 expression and proliferation were analyzed on day 4 after OVA treatment. FACS plots are gated on CD4+ cells. Data are representative of 3 experiments (2 mice per experiment). (f) BALB/c RAG−/− or TCR α−/− β−/− mice were transferred with 5 × 10⁶ splenic CD4+ Foxp3 T cells from WT Foxp3GFP mice (3 experiments, 2 mice per group), and cells transferred into RAG−/− were labeled with 5 µM eFluor 670. Nrp1 expression and proliferation were analyzed 1 wk after injection (pooled spleen and LN). FACS plots are gated on CD4+ Thy1.1+ Thy1.2 cells (transferred cells). Additionally BALB/c TCR α−/− β−/− mice were treated for 1 wk with broad spectrum antibiotics and transferred with 5 × 10⁶ splenic CD4+ Foxp3 T cells from WT Foxp3GFP mice. After 1 wk of continued antibiotic treatment, T reg populations were sorted from pooled spleen and LNs. The graph in the bottom panel shows qPCR of Dapl1 expression by the in vivo–generated iT reg cells. (n = 2 biological replicates run in duplicate pooled from 2 groups of 3 mice). Significance was determined by nonparametric Mann-Whitney U test.
Figure 5.
Figure 5.
Nrp1 expression is controlled by TGF-β. (a) Splenic Nrp1+ and Nrp1 T reg cells were FACS-sorted from WT mice and cultured in the presence or absence of plate-bound anti-CD3 and soluble anti-CD28 and IL-2 (left). Nrp1+ and Nrp1 T reg cells were also cultured together with naive T cells in the presence of the indicated cytokines (middle and right). Stability of Nrp1 expression was assessed 4 d after culture. FACS plots are gated on CD4+ Foxp3GFP+ cells. Histograms are representative of one out of two independent experiments performed in duplicate. (b) T reg cells were sorted from WT or OVA-fed TBmc mice and cultured for 4 d in the presence of plate-bound anti-CD3 and soluble anti-CD28 and IL-2 with or without TGF-β. Foxp3 Nrp1 CD4+ T cells were also sorted from TBmc mice treated with OVA and Nrp1 expression analyzed 4 d after culture. FACS plots are gated on CD4+ Foxp3GFP+ cells. Histograms are representative of one out of two independent experiments performed in duplicate. (c) In vitro iT reg cells were generated as in Fig. 4 d, with the addition of 10 nM of retinoic acid. FACS plots are gated on CD4+ Foxp3GFP+ cells. Data are representative of two experiments run in duplicate. (d) Thymi and spleens of 2.5-wk-old TGF-β receptor II–deficient mice and heterozygous littermates were harvested, and Nrp1 expression by CD4+ T cells were cells analyzed. FACS plots are gated on CD4+ CD8 cells. Data are representative of 3 independent experiments (n = 2 mice/group).
Figure 6.
Figure 6.
Both Nrp1+ and Nrp1 T reg cells from WT mice can suppress immune responses in vitro and in vivo. (a) In vitro suppression assay. Naive T cells from WT mice were co-cultured in a 1:1, 1:0.3, or 1:0.1 ratio (Naive T: T reg) with the indicated T reg populations and with APCs in the presence of anti-CD3. As a control, naive T cells were cultured in the absence of T reg cells, but in the presence of additional naive T cells at the indicated ratios. Cell proliferation was measured by [3H]-thymidine incorporation. Graph is representative of two independent experiments run in triplicate. (b) Nrp1+ and Nrp1 T reg cells in suppression of Th2 response. TBmc mice were transferred or not with the indicated T reg population from the Foxp3GFP+ KJ1.26+ population of TBmc RAG+ mice (2 × 10⁵ cells/mouse), and 24 h later, immunized with OVA-HA adsorbed in alum. IgE and IgG1 serum levels were analyzed by ELISA 2 wk after immunization (n = 3 mice/group, 2 independent experiments). Significance was determined by unpaired Student’s t test. (c) Nrp1+ and Nrp1 T reg cells distribution in the spleen under steady state. Confocal images of spleen sections showing the distribution of Nrp1+ and Nrp1 T reg cells in the white pulp. Sections were stained with anti-Nrp1, Foxp3 and B220. Bar, 50 µm. 60× magnification. (right) 2.5× digital zoom of inset from left pane; bar, 25 µm. Black arrowheads point to Nrp1+ T reg cells, and white arrowheads point to Nrp1 T reg cells. Images are representative of at least three different mice.
Figure 7.
Figure 7.
Tumor-infiltrating T reg cells are enriched in iT reg cells. (a) C57BL/6 were injected i.p. with 2 × 10⁵ MCA38 cells. After 2 wk, tumor and spleen were harvested and Nrp1 expression on CD4+ T cells was analyzed by FACS. FACS plots are gated on CD4+ CD45+ cells. Dot plots are representative of 2 different experiments (n = 5 mice/group). (b) Real-time PCR analysis of sorted CD4+ Foxp3+ T reg cells from MCA38 tumor-infiltrating T reg cells. n = 2 biological replicates run in duplicate. P < 0.05 for Nrp1, Swap 70, Helios, and Dapl1; P = 0.85 for Foxp3. Significance was determined by non parametric Mann-Whitney U test. (c) BALB/c mice were injected subcutaneously on the right flank with 5 × 10⁴ 4T1 cells. After 2 wk, tumor and spleen were harvested and Nrp1 expression on CD4+ T cells was analyzed by FACS. FACS plots are gated on CD4+ CD45+ CD3+ cells. Dot plots are representative of 2 different experiments (n = 4 mice/group). (d) Statistical analysis of the percentage of Nrp1 cells contained within each Foxp3+ population from mice bearing or not 4T1 tumors. Graph is representative of one experiment. Significance was determined by unpaired Student’s t test.
Figure 8.
Figure 8.
iT reg cells from inflamed central nervous system express Nrp1. (a and b) The frequency of T reg cells in the spleen and spinal cords of MBP-Tg/TCRαβ−/− mice during the different stages of spontaneous EAE was analyzed by flow cytometry. Dot-plots show frequency of Foxp3+ cells among total CD4+ CD45High cells. Pre-clinical, before onset of EAE (4–5 wk old); sub-clinical, 1 d after weight loss, but before onset of EAE; acute, 3–7 d after onset of EAE; chronic, 20–30 d after onset of EAE. Dot plots are representative of 1 out of 2–8 mice analyzed/group during a 4–8-wk period. Graph shows all mice analyzed. Unpaired Student’s t test was used to determine significance. (c) qPCR analysis of Dapl1 expression by the indicated T reg cell populations (n = 2 biological replicates run in duplicate) sorted from either spleen of healthy WT mice or spinal cords of mice afflicted by EAE. Significance was determined by nonparametric Mann-Whitney U test. (d) EAE was monitored in homozygous MBP-Tg/Tg Foxp3-sufficient mice (MBP-Tg/TgFoxp3wt, n = 30), or Foxp3-deficient scurfy mice (MBP-Tg/TgFoxp3sf, n = 10), and hemizygous MBP-Tg and Foxp3-sufficient mice (MBP-TgFoxp3wt, n = 10) that harbor nT reg cells. Mice that died during the follow-up period were scored as level 5, and were included in calculation of the mean score. (e) Expression of Nrp1 by T reg of MBP-Tg/TCRαβ−/− mice with EAE, compared with hemizygous MBP-Tg TCRαβ-sufficient mice and to WT mice. Numbers on the left indicate the percentage of Nrp1 cells among CD4+ Foxp3+ cells. SC, spinal cord. FACS plots are gated on CD4+ CD45High cells. Data are representative of at least three independent experiments with at least two mice per group. (f) MBP-Tg/Tg mice afflicted by acute EAE were transferred with T reg cells (Nrp1+ or Nrp1 as indicated) sorted from spleens of healthy MBP-Tg Foxp3-GFP mice. Nrp1 levels among transferred T reg cells were analyzed 48 h after transfer. FACS plots are gated on CD4+ CD45+ cells. Histograms are representative of two independent experiments (two mice per group). (g) Thy1.2+ Nrp1+ T reg cells were sorted from spinal cords (SC) of MBP-Tg/Tg Foxp3-GFP mice afflicted by chronic EAE and transferred into Thy1.1 congenic recipients. On the following day, mice were injected i.p. with 10 µM MBP[4Y] peptide. Nrp1 levels on the transferred T reg cells were analyzed 4 d after peptide injection. FACS plots are gated on CD4+ CD45+ cells. Representative of two mice per group.
Figure 9.
Figure 9.
iT reg cells from inflamed lungs are Nrp1+. (a) TBmc mice were immunized i.p. with OVA cross-linked to hemagglutinin peptide adsorbed in alum and treated intranasally twice a week with OVA-HA. After 8 wk of OVA-HA intranasal administration, lungs, mediastinal LN, and spleen were harvested and stained for CD4 and Foxp3. WT BALB/c mouse was used as control. FACS plots are gated on CD4+ CD45+ cells. (b) Nrp1 expression by Foxp3+ T reg cells shown in panel a. FACS plots are gated on CD4+ CD45+ Foxp3+ cells. Data are representative of 2 experiments (n = 2 mice/experiment).
Figure 10.
Figure 10.
Foxp3Nrp1+ cells are activated T cells not related to the T reg lineage. (a) Thymic Thy1.2+ CD4SP Foxp3GFP− Nrp1+ T cells were intrathymically injected into Thy1.1+ congenic mice using ultrasound guidance. Nrp1 and Foxp3 expression by splenic CD4+ cells was analyzed 1–2 wk later. Cells are gated on Thy1.2+ Thy1.1 CD4SP T cells. Dot plots are representative of 2 independent experiments (n = 2 mice/group). (b) Nrp1+ CD4+ T cells have a memory/activated phenotype. Spleens of steady-state Foxp3GFP mice were harvested and the indicated activation markers were analyzed by flow cytometry. Dotted line indicates separation of Nrp1+ and Nrp1 populations. All plots are gated on CD4+ CD8 cells. Histograms and dot plots are representative of one out of three different mice.

References

    1. Apostolou I., von Boehmer H. 2004. In vivo instruction of suppressor commitment in naive T cells. J. Exp. Med. 199:1401–1408 10.1084/jem.20040249 - DOI - PMC - PubMed
    1. Atarashi K., Tanoue T., Shima T., Imaoka A., Kuwahara T., Momose Y., Cheng G., Yamasaki S., Saito T., Ohba Y., et al. 2011. Induction of colonic regulatory T cells by indigenous Clostridium species. Science. 331:337–341 10.1126/science.1198469 - DOI - PMC - PubMed
    1. Bailey-Bucktrout S.L., Bluestone J.A. 2011. Regulatory T cells: stability revisited. Trends Immunol. 32:301–306 10.1016/j.it.2011.04.002 - DOI - PMC - PubMed
    1. Bennett C.L., Christie J., Ramsdell F., Brunkow M.E., Ferguson P.J., Whitesell L., Kelly T.E., Saulsbury F.T., Chance P.F., Ochs H.D. 2001. The immune dysregulation, polyendocrinopathy, enteropathy, X-linked syndrome (IPEX) is caused by mutations of FOXP3. Nat. Genet. 27:20–21 10.1038/83713 - DOI - PubMed
    1. Bettelli E., Carrier Y., Gao W., Korn T., Strom T.B., Oukka M., Weiner H.L., Kuchroo V.K. 2006. Reciprocal developmental pathways for the generation of pathogenic effector TH17 and regulatory T cells. Nature. 441:235–238 10.1038/nature04753 - DOI - PubMed

Publication types

MeSH terms