

Role of the transcription factor erythroblastosis virus E26 oncogen homolog-1 (ETS-1) as mediator of the renal proinflammatory and profibrotic effects of angiotensin II
- PMID: 22966006
- PMCID: PMC4309546
- DOI: 10.1161/HYPERTENSIONAHA.112.197871
Role of the transcription factor erythroblastosis virus E26 oncogen homolog-1 (ETS-1) as mediator of the renal proinflammatory and profibrotic effects of angiotensin II
Abstract
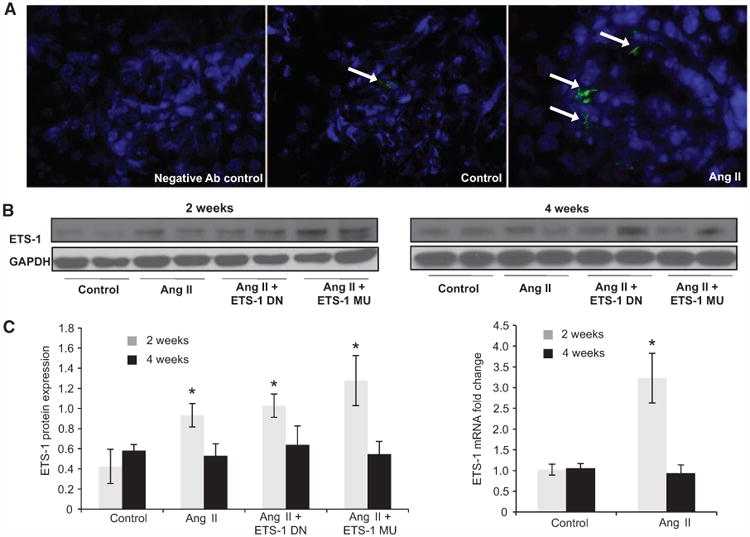
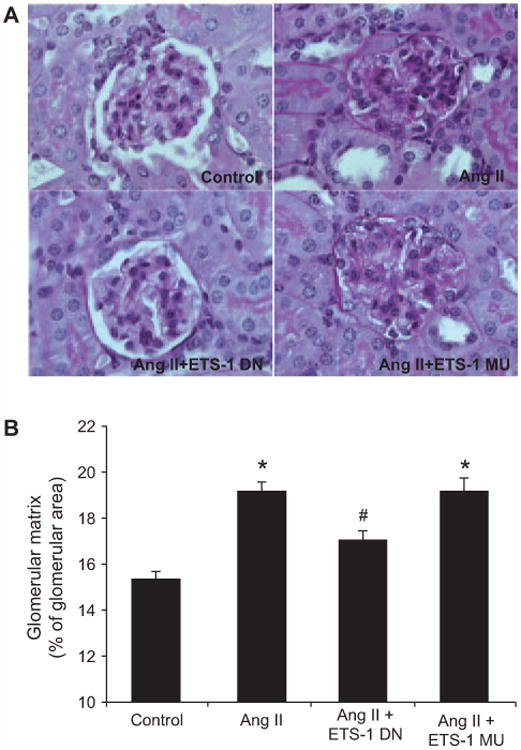
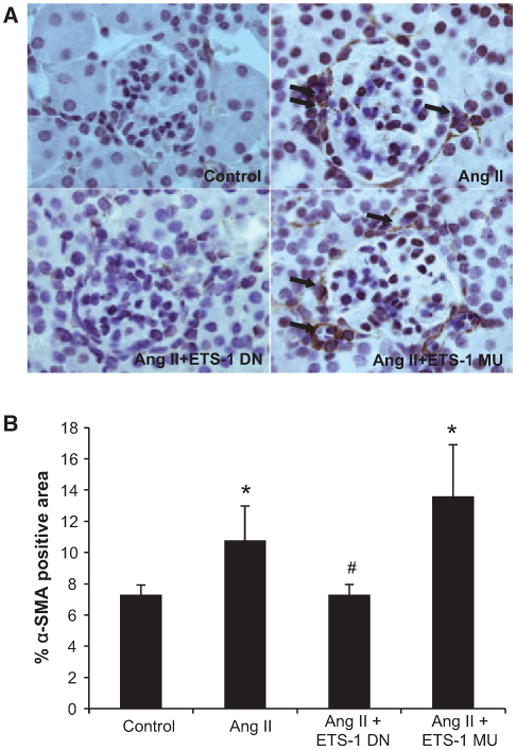
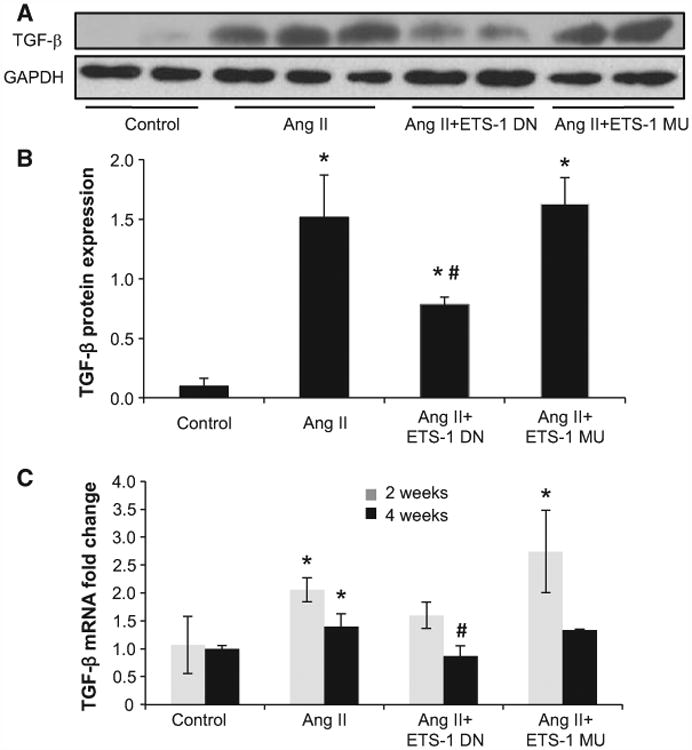
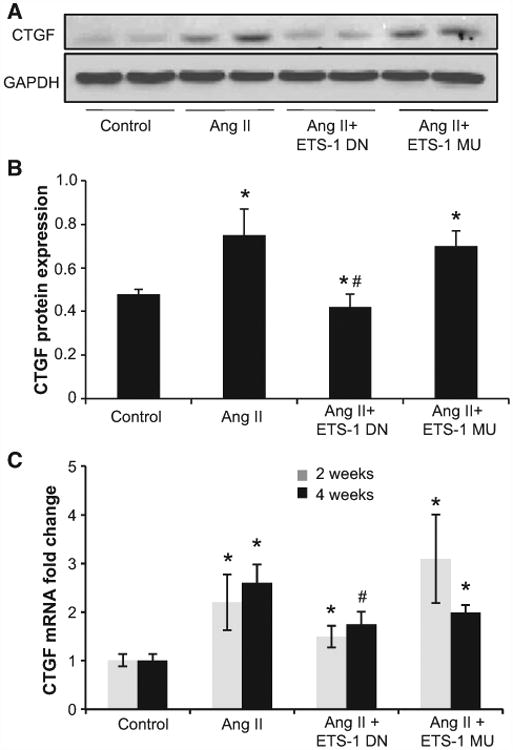
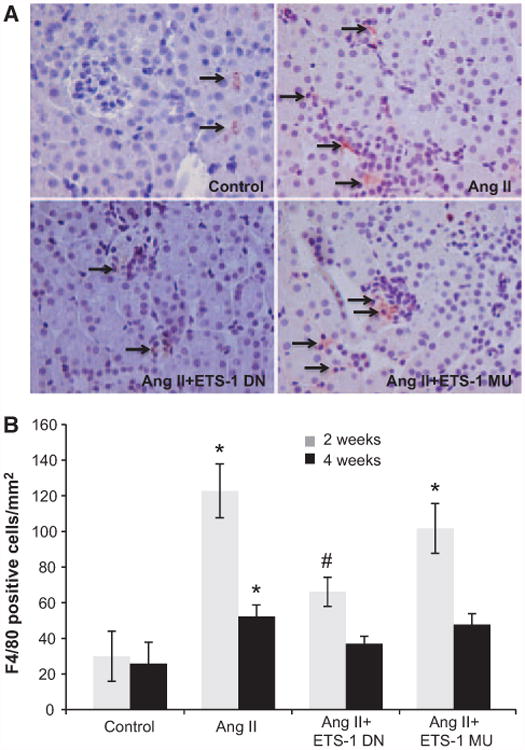
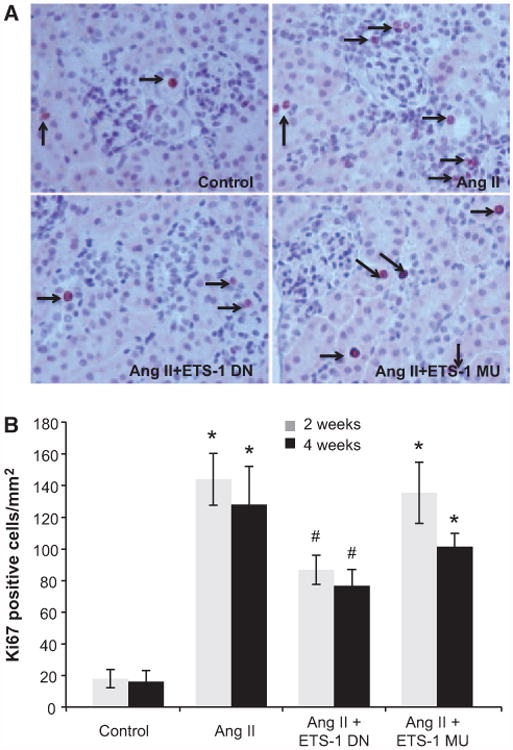
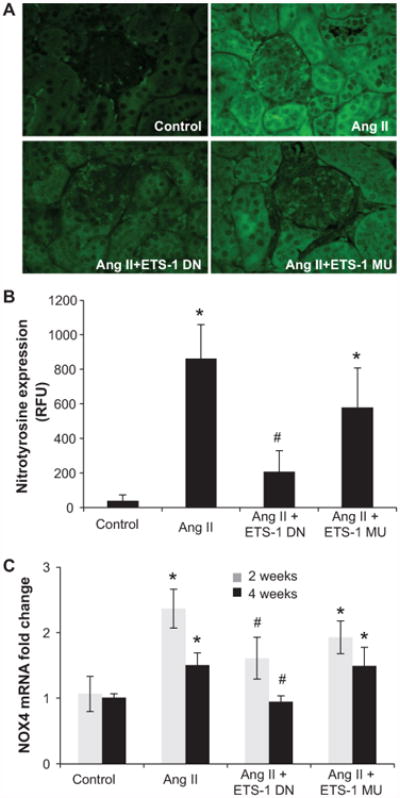
Angiotensin II (Ang II) plays a major role in the pathogenesis of end-organ injury in hypertension via its diverse hemodynamic and nonhemodynamic effects. Erythroblastosis virus E26 oncogen homolog-1 (ETS-1) is an important transcription factor recently recognized as an important mediator of cell proliferation, inflammation, and fibrosis. In the present studies, we tested the hypothesis that ETS-1 is a common mediator of the renal proinflammatory and profibrotic effects of Ang II. C57BL6 mice (n=6 per group) were infused with vehicle (control), Ang II (1.4 mg/kg per day), Ang II and an ETS-1 dominant-negative peptide (10 mg/kg per day), or Ang II and an ETS-1 mutant peptide (10 mg/kg per day) via osmotic minipump for 2 or 4 weeks. The infusion of Ang II resulted in significant increases in blood pressure and left ventricular hypertrophy, which were not modified by ETS-1 blockade. The administration of ETS-1 dominant-negative peptide significantly attenuated Ang II-induced renal injury as assessed by urinary protein excretion, mesangial matrix expansion, and cell proliferation. Furthermore, ETS-1 dominant-negative peptide but not ETS-1 mutant peptide significantly reduced Ang II-mediated upregulation of transforming growth factor-β, connective tissue growth factor, and α-smooth muscle actin. In addition, ETS-1 blockade reduced several proinflammatory effects of Ang II, including macrophage infiltration, nitrotyrosine expression, and NOX4 mRNA expression. Our studies suggest that ETS-1 is a common mediator of the proinflammatory and profibrotic effects of Ang II-induced hypertensive renal damage and may result in the development of novel strategies in the treatment and prevention of end-organ injury in hypertension.
Figures
Similar articles
-
Transcription factor avian erythroblastosis virus E26 oncogen homolog-1 is a novel mediator of renal injury in salt-sensitive hypertension.Hypertension. 2015 Apr;65(4):813-20. doi: 10.1161/HYPERTENSIONAHA.114.04533. Epub 2015 Jan 26. Hypertension. 2015. PMID: 25624342 Free PMC article.
-
Angiotensin II increases the expression of the transcription factor ETS-1 in mesangial cells.Am J Physiol Renal Physiol. 2008 May;294(5):F1094-100. doi: 10.1152/ajprenal.00458.2007. Epub 2008 Mar 12. Am J Physiol Renal Physiol. 2008. PMID: 18337545
-
Prevention of angiotensin II-mediated renal oxidative stress, inflammation, and fibrosis by angiotensin-converting enzyme 2.Hypertension. 2011 Feb;57(2):314-22. doi: 10.1161/HYPERTENSIONAHA.110.164244. Epub 2010 Dec 28. Hypertension. 2011. PMID: 21189404
-
Transcription Factor ETS-1 and Reactive Oxygen Species: Role in Vascular and Renal Injury.Antioxidants (Basel). 2018 Jul 3;7(7):84. doi: 10.3390/antiox7070084. Antioxidants (Basel). 2018. PMID: 29970819 Free PMC article. Review.
-
Role of arterial hypertension and angiotensin II in chronic kidney disease (Review).Exp Ther Med. 2023 Feb 16;25(4):153. doi: 10.3892/etm.2023.11852. eCollection 2023 Apr. Exp Ther Med. 2023. PMID: 36911375 Free PMC article. Review.
Cited by
-
Genome-wide and candidate gene association studies of placental abruption.Int J Mol Epidemiol Genet. 2013 Sep 12;4(3):128-39. eCollection 2013. Int J Mol Epidemiol Genet. 2013. PMID: 24046805 Free PMC article.
-
A Transcriptional Regulatory Role for the Membrane Type-1 Matrix Metalloproteinase in Carcinogen-Induced Inflammasome Gene Expression.Gene Regul Syst Bio. 2017 Jun 8;11:1177625017713996. doi: 10.1177/1177625017713996. eCollection 2017. Gene Regul Syst Bio. 2017. PMID: 28634425 Free PMC article.
-
Ferritin Light Chain Confers Protection Against Sepsis-Induced Inflammation and Organ Injury.Front Immunol. 2019 Feb 4;10:131. doi: 10.3389/fimmu.2019.00131. eCollection 2019. Front Immunol. 2019. PMID: 30804939 Free PMC article.
-
Angiotensin II triggers RIPK3-MLKL-mediated necroptosis by activating the Fas/FasL signaling pathway in renal tubular cells.PLoS One. 2020 Mar 5;15(3):e0228385. doi: 10.1371/journal.pone.0228385. eCollection 2020. PLoS One. 2020. PMID: 32134954 Free PMC article.
-
Transcription factor avian erythroblastosis virus E26 oncogen homolog-1 is a novel mediator of renal injury in salt-sensitive hypertension.Hypertension. 2015 Apr;65(4):813-20. doi: 10.1161/HYPERTENSIONAHA.114.04533. Epub 2015 Jan 26. Hypertension. 2015. PMID: 25624342 Free PMC article.
References
-
- Zhou MS, Hernandez Schulman I, Pagano PJ, Jaimes EA, Raij L. Reduced NAD(P)H oxidase in low renin hypertension: link among angiotensin II, atherogenesis, and blood pressure. Hypertension. 2006;47:81–86. - PubMed
-
- Anderson S, Jung FF, Ingelfinger JR. Renal renin-angiotensin system in diabetes: functional, immunohistochemical, and molecular biological correlations. Am J Physiol. 1993;265(4 pt 2):F477–F486. - PubMed
-
- Floege J, Burns MW, Alpers CE, Yoshimura A, Pritzl P, Gordon K, Seifert RA, Bowen-Pope DF, Couser WG, Johnson RJ. Glomerular cell proliferation and PDGF expression precede glomerulosclerosis in the remnant kidney model. Kidney Int. 1992;41:297–309. - PubMed
-
- Floege J, Johnson RJ, Gordon K, Yoshimura A, Campbell C, Iruela-Arispe L, Alpers CE, Couser WG. Altered glomerular extracellular matrix synthesis in experimental membranous nephropathy. Kidney Int. 1992;42:573–585. - PubMed
Publication types
MeSH terms
Substances
Grants and funding
LinkOut - more resources
Full Text Sources
Medical
Miscellaneous
