. 2013 Jan;62(1):137-48.
doi: 10.2337/db11-1388. Epub 2012 Sep 10.

Tub has a key role in insulin and leptin signaling and action in vivo in hypothalamic nuclei

Affiliations

Tub has a key role in insulin and leptin signaling and action in vivo in hypothalamic nuclei

Patrícia O Prada et al. Diabetes. 2013 Jan.

Retraction in

Expression of concern in

Abstract

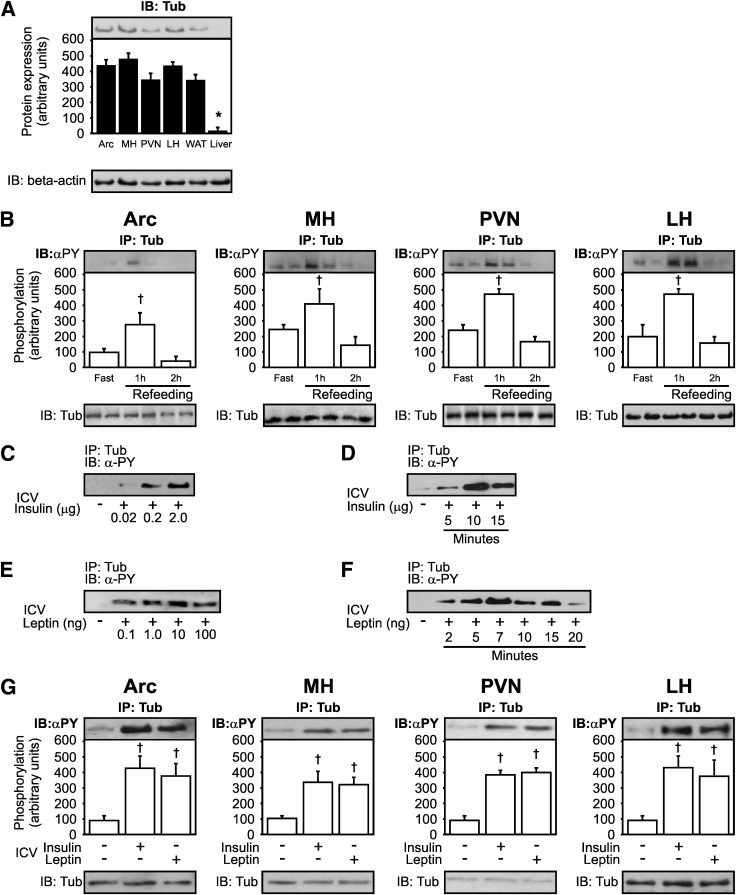
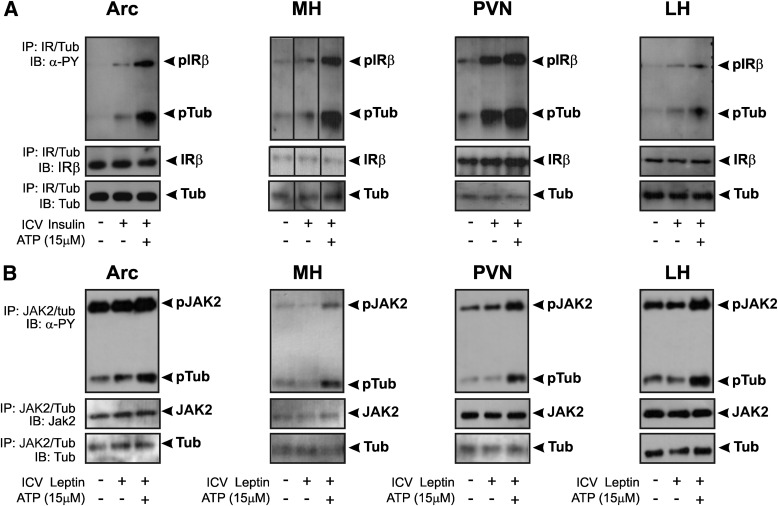
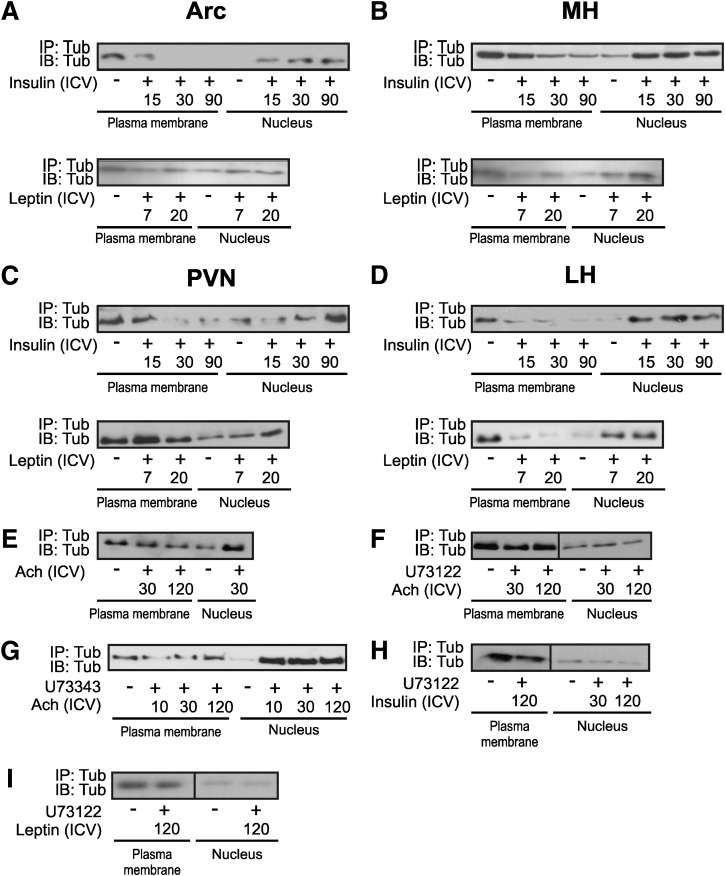
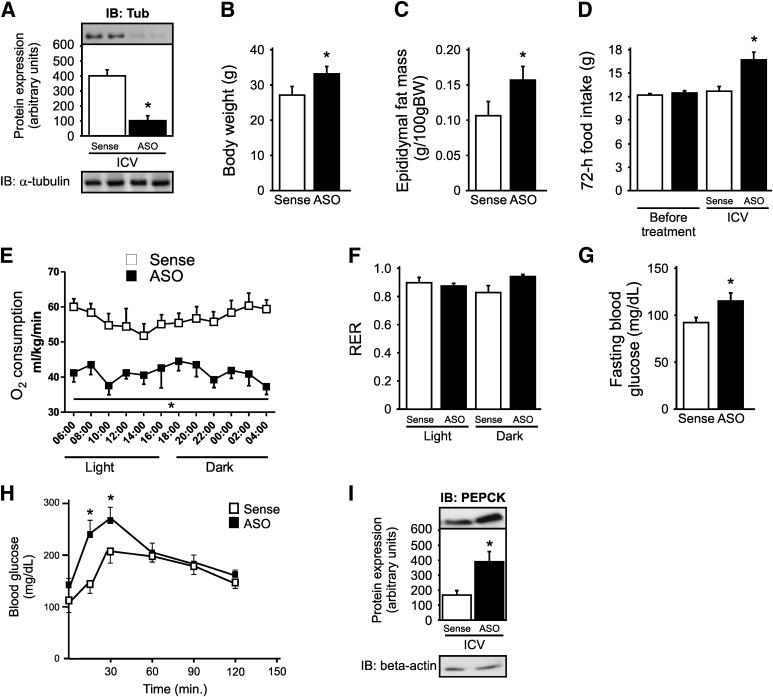
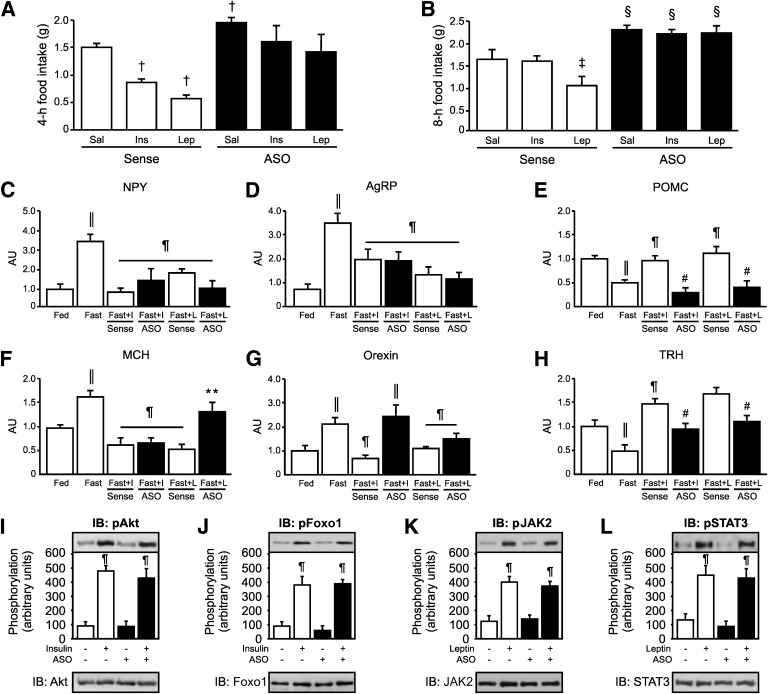
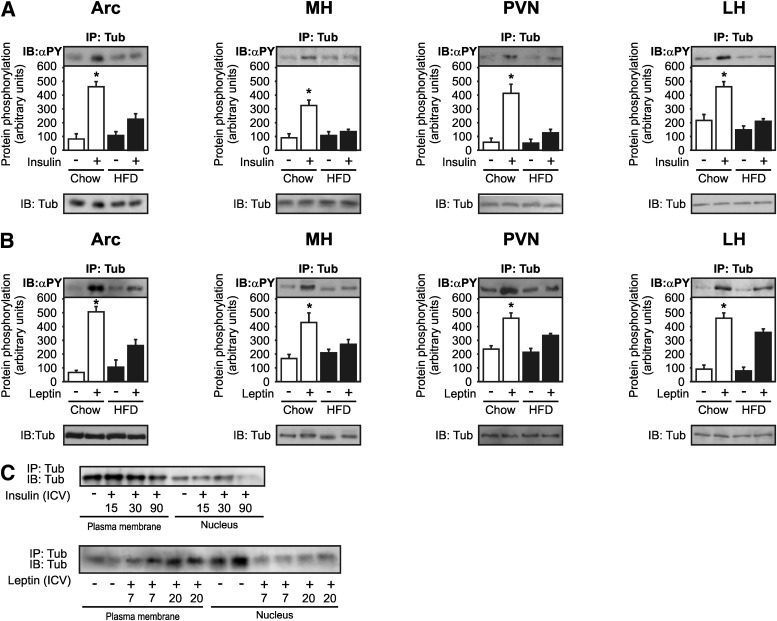
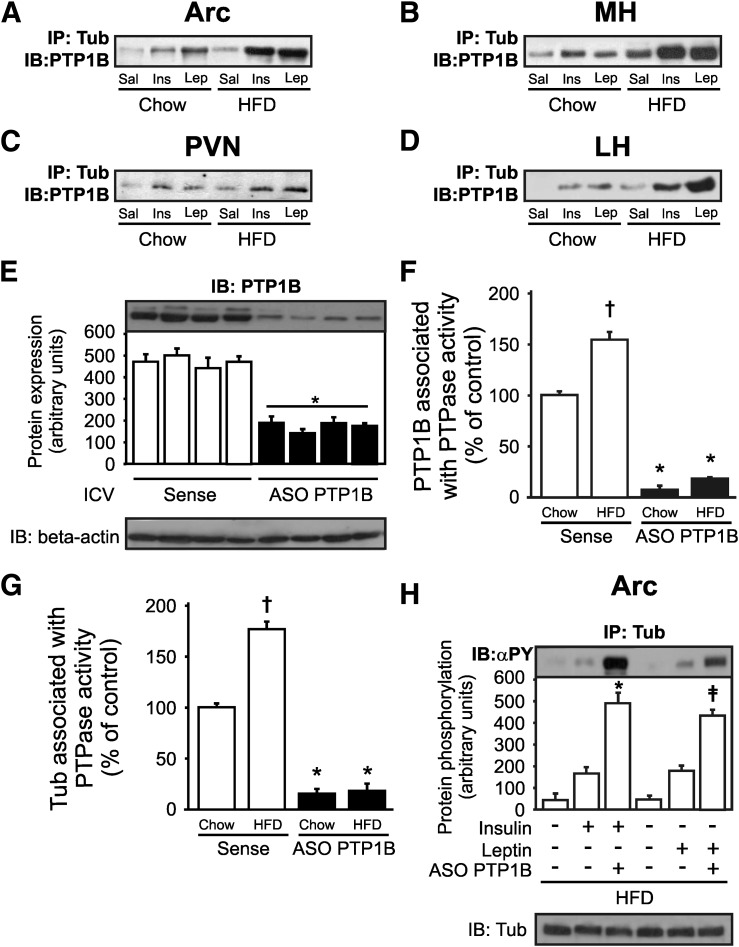
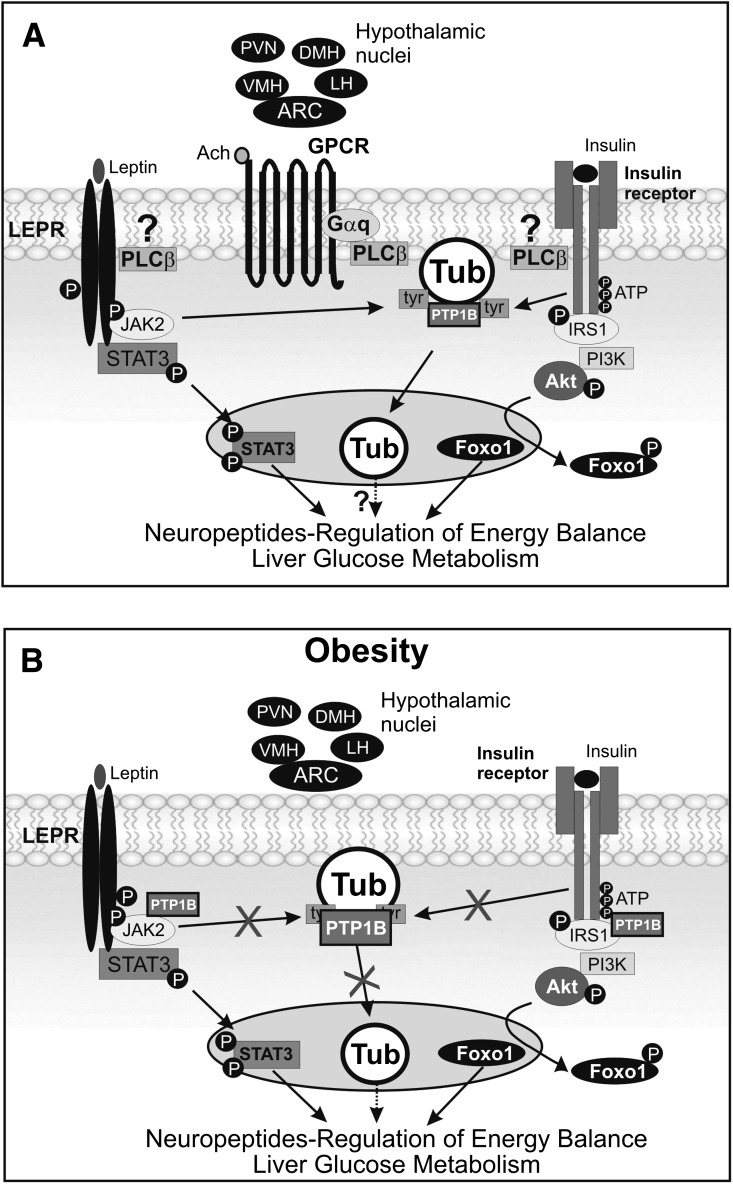
Mutation of tub gene in mice induces obesity, suggesting that tub could be an important regulator of energy balance. In the current study, we investigated whether insulin, leptin, and obesity can modulate Tub in vivo in hypothalamic nuclei, and we investigated possible consequences on energy balance, neuropeptide expression, and hepatic glucose metabolism. Food intake, metabolic characteristics, signaling proteins, and neuropeptide expression were measured in response to fasting and refeeding, intracerebroventricular insulin and leptin, and Tub antisense oligonucleotide (ASO). Tub tyrosine phosphorylation (Tub-p-tyr) is modulated by nutritional status. Tub is a substrate of insulin receptor tyrosine kinase (IRTK) and leptin receptor (LEPR)-Janus kinase 2 (JAK2) in hypothalamic nuclei. After leptin or insulin stimulation, Tub translocates to the nucleus. Inhibition of Tub expression in hypothalamus by ASO increased food intake, fasting blood glucose, and hepatic glucose output, decreased O(2) consumption, and blunted the effect of insulin or leptin on proopiomelanocortin, thyroid-releasing hormone, melanin-concentrating hormone, and orexin expression. In hypothalamus of mice administered a high-fat diet, there is a reduction in leptin and insulin-induced Tub-p-tyr and nuclear translocation, which is reversed by reducing protein tyrosine phosphatase 1B expression. These results indicate that Tub has a key role in the control of insulin and leptin effects on food intake, and the modulation of Tub may contribute to insulin and leptin resistance in DIO mice.


Figures

FIG. 1.
FIG. 1.
Expression of Tub, effect of nutritional states, and effect of insulin and leptin on Tub-p-tyr in hypothalamic nuclei. A: Representative blots of Tub protein expression in hypothalamic nuclei, including Arc, MH, PVN, LH, white adipose tissue (WAT), and liver. B: Effect of fasting (24 h) and refeeding on Tub-p-tyr in hypothalamic nuclei. Mice were killed at 10 min (C) or at 7 min (E) after hormone injections to determine the dose-response of ICV insulin or leptin on Tub-p-tyr. The different doses of insulin were: 0, 0.02, 0.2, and 2.0 μg; the different doses of leptin were: 0, 0.1, 1.0, 10, and 100 ng. To determine the time-course of Tub-p-tyr in response to insulin (D) or leptin (F), we used 2-µg (D) and 10-ng (F) doses, and mice were killed at different time points: 5, 10, and 15 min for insulin or 2, 5, 7, 10, 15, and 20 min for leptin. G: Tub-p-tyr is increased in response to ICV insulin (2 µg) or leptin (10 ng) in hypothalamic nuclei. Data are presented as means ± SD from 8 mice per nucleus or whole hypothalamus from 8 to 10 mice. One-way ANOVA with Bonferroni posttest was used. *P < 0.05 vs. other groups, †P < 0.05 vs. fast. α-PY, antiphosphotyrosine; ICV, ICV injection; IB, immunoblotting.
FIG. 2.
FIG. 2.
Tyrosine kinase assay of IR and JAK2 using Tub as a substrate. A: 0.2 μg insulin or (B) 0.1 ng leptin was injected into lateral ventricle to increase IR or LEPR-associated JAK2 phosphorylation, respectively. Hypothalamic nuclei were dissected, and IP was performed with anti-IR antibody for insulin-stimulated mice (n = 7) or anti-JAK2 antibody for leptin-stimulated mice (n = 5). In another group of animals (n = 7), hypothalamic nuclei were dissected without insulin or leptin stimulation, and samples underwent IP with anti-Tub antibody. After combining IP samples (IR with Tub) for insulin-stimulated mice or (JAK2 with Tub) for leptin-stimulated mice, they were incubated with ATP and blotted with antiphosphotyrosine (α-PY). Representative blots show insulin-induced IR and Tub-p-tyr--induced and leptin-induced JAK2 and Tub-p-tyr in Arc, MH, PVN, and LH of mice fed chow. ICV, ICV injection.
FIG. 3.
FIG. 3.
Tub nuclear translocation in response to hormones in hypothalamic nuclei. A pool of 20 mice was used for each time point (AD). Arc, MH, PVN, and LH were dissected from the same mice, and the plasma membrane and nucleus fractions were obtained from the same samples. EI: Whole hypothalami of 14 mice were used. Plasma membranes and nuclear lysates underwent IP and were blotted (IB) with anti-Tub antibody. Tub nuclear translocation in response to ICV (2 μg) insulin (0, 15, 30, 90 min) or (10 ng) leptin (0, 7, 20 min) was investigated in Arc (A), MH (B), PVN (C), and LH (D) of mice on chow. Tub nuclear translocation in response to ICV (E) 100 μmol/L acetylcholine (Ach) (0, 30, 120 min), (F) 1 μmol/L specific PLCβ inhibitor (U73122) plus Ach (0, 10, 30, 120 min), (G) 1 μmol/L unspecific PLCβ inhibitor (U73343) plus Ach (0, 10, 30, 120 min), U73122 plus insulin (0, 30, 120 min) (H), and U73122 plus leptin (0, 120 min) (I) were investigated in the hypothalamus of mice fed chow diet. U73122 and U73343 inhibitors were administered 30 min before hormone injections. ICV, ICV injection.
FIG. 4.
FIG. 4.
Metabolic characteristics of mice treated with Tub ASO. A: ICV injection of Tub ASO for 5 days decreases 80–90% of Tub expression in the hypothalamus compared with sense controls. Body weight (B), epididymal fat mass (C), and cumulative food intake (D) are enhanced in Tub ASO-treated mice. O2 consumption (E) is decreased in Tub ASO-treated mice without change in respiratory exchange rate (F) (RER). Fasting blood glucose (G), blood glucose after a pyruvate load (H), and PEPCK protein expression (I) are enhanced in mice treated with Tub ASO. For pyruvate tolerance test, we injected 2 g/kg sodium pyruvate (intraperitoneal) in fasted mice, and blood glucose levels were measured using a glucometer at 0, 15, 30, 60, 90, and 120 min. Data are presented as means ± SD from 8–10 mice. Two-tailed Student t test (A–C, G) or one-way ANOVA (D, F, I) or two-way ANOVA (E, H) with Bonferroni posttest were used. *P < 0.05 vs. sense.
FIG. 5.
FIG. 5.
Food intake and hypothalamic neuropeptide expression in response to insulin or leptin in mice treated with Tub ASO. The 4-h (A) or 8-h (B) food intake in response to ICV insulin or leptin is impaired in mice treated for 5 days with Tub ASO. C–I: Neuropeptide expression (mRNA levels) in response to ICV insulin and leptin are altered in the hypothalamus of ASO-treated mice. J and K: Akt and Foxo1 phosphorylation are increased in response to ICV insulin in the hypothalamus of Tub ASO-treated mice. L and M: JAK2 and STAT3 phosphorylation in response to leptin are increased in the hypothalamus of ASO-treated mice. Data are presented as means ± SD from 8–10 mice. One-way ANOVA with Bonferroni posttest was used. Sense: ASO control. *P < 0.05 vs. sense; †P < 0.05 vs. saline sense; ‡P < 0.05 vs. saline and insulin sense; §P < 0.05 vs. saline, insulin, and leptin sense; ‖P < 0.05 vs. fed; ¶ vs. fast; # vs. fast with insulin (fast + I) and fast with leptin (fast + L) sense; ** vs. fast + L sense. AU, arbitrary units; ICV, ICV injection; Sal, saline; ins, insulin; lep, leptin; NPY, neuropeptide Y; AgRP, agouti-related peptide.
FIG. 6.
FIG. 6.
Tub-p-tyr and translocation in response to insulin and leptin are impaired in mice fed HFD. Representative blots (n = 5 each nucleus) show insulin- (A) and leptin-induced (B) Tub-p-tyr in Arc, MH, PVN, and LH of mice fed chow or HFD. A pool of 20 mice was used for each time point. Plasma membranes and nuclear lysates underwent IP and were blotted (IB) with anti-Tub antibody. Tub nuclear translocation in response to ICV insulin (0, 15, 30, 90 min) or leptin (0, 7, 20 min) is investigated in the hypothalamus of mice fed a HFD. Data are presented as means ± SD. One-way ANOVA with Bonferroni posttest was used. α-PY, antiphosphotyrosine; *P < 0.05 vs. fast on chow diet.
FIG. 7.
FIG. 7.
Tub/PTP1B association in response to insulin or leptin is higher in hypothalamic nuclei of mice fed a HFD. A–D: Representative blots show Tub/PTP1B association in response to ICV insulin (2 µg) or leptin (10 ng) in mice fed chow. This effect is greater in mice fed a HFD in Arc, MH, PVN, and LH of mice fed chow and HFD. E: PTP1B expression is reduced in mice fed a HFD treated with PTP1B ASO for 5 days. F: PTPase activity is increased by HFD and is reduced by PTP1B ASO treatment in mice fed a HFD. G: Tub associated with PTPase activity is greater in mice fed a HFD and is decreased by PTP1B ASO treatment. In this experiment, hypothalami were homogenized and centrifuged, and the supernatants were immunoprecipitated with anti-Tub antibody. Then, immune complexes were incubated with pp60c-src COOH-terminal phosphoregulatory peptide (TSTEPQpYQPGENL; Biomol) for 1 h at 30°C. To determine PTPase activity in a spectrophotometer, 40-μL aliquots with 100 μL Biomol Green reagent (Biomol) were used. H: Tub tyrosine phosphorylation in response to insulin or leptin is higher in mice fed a HFD treated with PTP1B ASO than in sense-treated mice. Data are presented as means ± SD from five mice per nucleus. One-way ANOVA with Bonferroni posttest was used. *P < 0.05 vs. sense, †P < 0.05 vs. mice fed chow treated with sense, ‡P < 0.05 PTP1B ASO groups. PTP1B, protein tyrosine phosphatase 1B; Sense, ASO control.
FIG. 8.
FIG. 8.
Tub signaling in the context of other energy balance pathways. A: Insulin receptor has tyrosine kinase activity and is able to induce PI3K/Akt/Foxo1 pathway activation, altering transcription of neuropeptides involved in the regulation of energy balance. Because LEPR has no tyrosine kinase activity, it recruits JAK2. The LEPR/JAK2 complex binds and activates STAT3, which migrates to the nucleus, regulating feeding through neuropeptide expression. Here, we suggest that phosphorylated IR and JAK2 are also able to induce Tub-p-tyr and translocation to the nucleus, accompanied by changes in neuropeptide expression and regulation of energy balance. In addition, we demonstrate that acetylcholine stimulates translocation of Tub via PLCβ in vivo and insulin-induced and leptin-induced Tub translocation may occur via PLCβ. B: Furthermore, in obesity insulin-induced or leptin-induced Tub-p-tyr in Arc, MH, PVN, and LH are blunted in parallel to enhanced PTP1B activation.

Similar articles

Cited by

References

    1. Belgardt BF, Brüning JC. CNS leptin and insulin action in the control of energy homeostasis. Ann N Y Acad Sci 2010;1212:97–113 - PubMed
    1. Carvalheira JB, Torsoni MA, Ueno M, et al. Cross-talk between the insulin and leptin signaling systems in rat hypothalamus. Obes Res 2005;13:48–57 - PubMed
    1. Morton GJ, Schwartz MW. The NPY/AgRP neuron and energy homeostasis. Int J Obes Relat Metab Disord 2001;25(Suppl 5):S56–S62 - PubMed
    1. Woods SC, Schwartz MW, Baskin DG, Seeley RJ. Food intake and the regulation of body weight. Annu Rev Psychol 2000;51:255–277 - PubMed
    1. Belgardt BF, Okamura T, Brüning JC. Hormone and glucose signalling in POMC and AgRP neurons. J Physiol 2009;587:5305–5314 - PMC - PubMed

Publication types