. 2013 Mar;62(3):789-800.
doi: 10.2337/db12-0365. Epub 2012 Sep 10.

The Wnt signaling pathway effector TCF7L2 controls gut and brain proglucagon gene expression and glucose homeostasis

Affiliations

The Wnt signaling pathway effector TCF7L2 controls gut and brain proglucagon gene expression and glucose homeostasis

Weijuan Shao et al. Diabetes. 2013 Mar.

Abstract

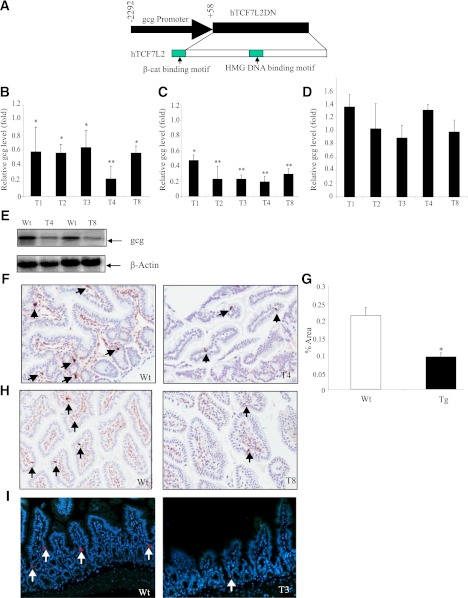
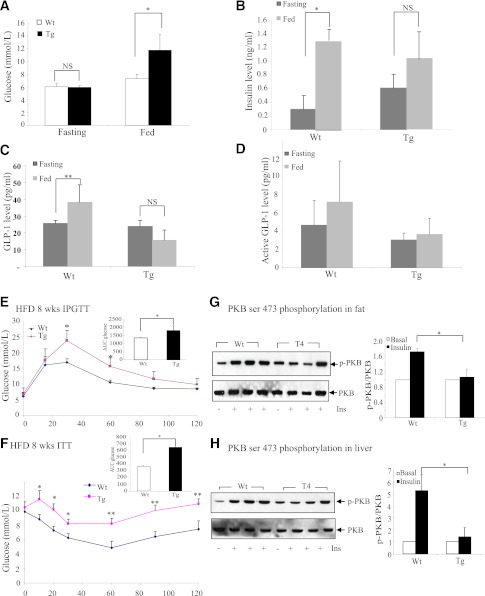
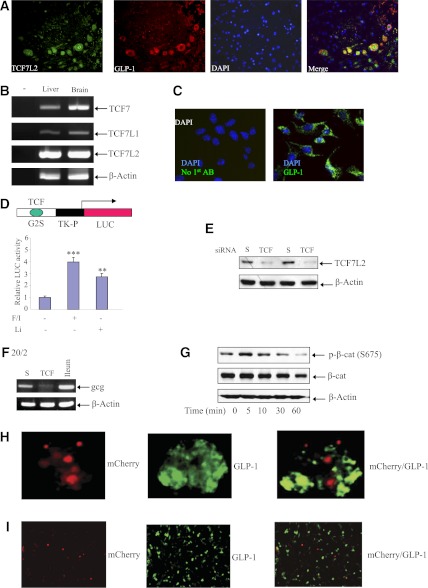
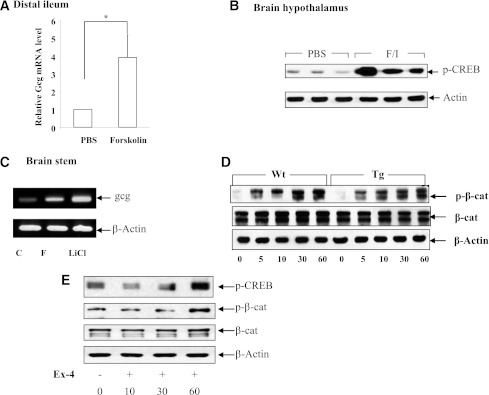
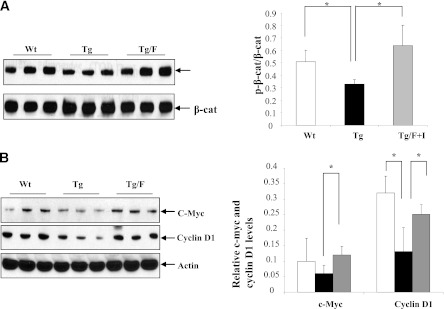
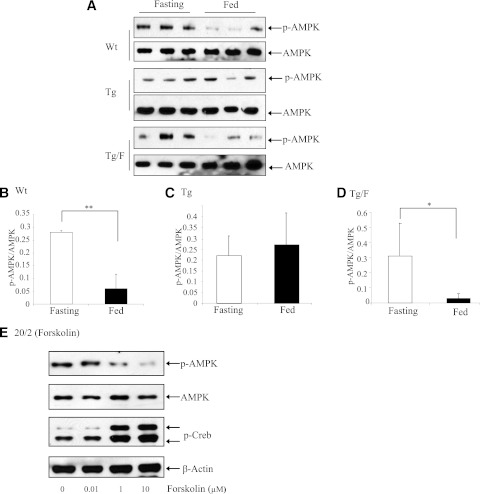
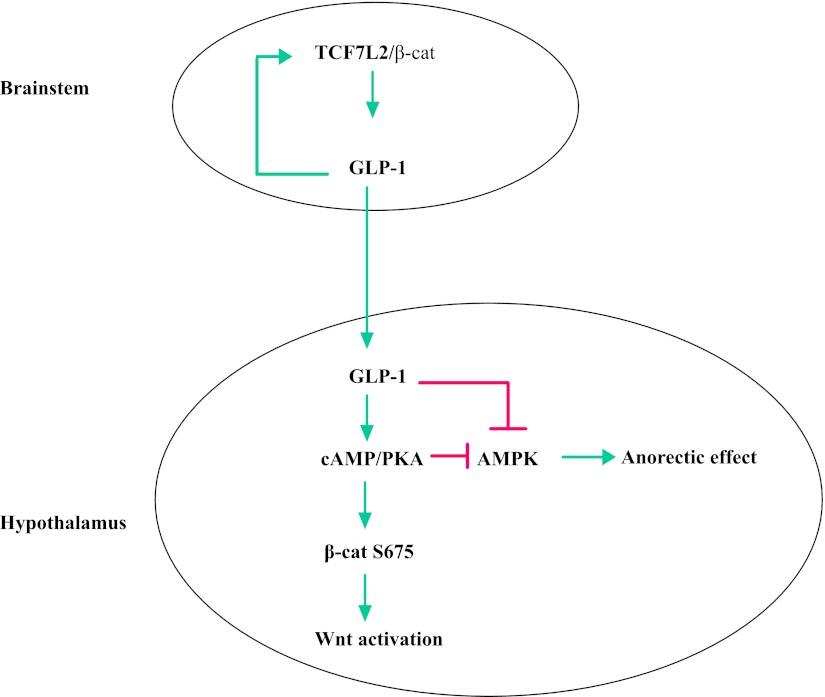
The type 2 diabetes risk gene TCF7L2 is the effector of the Wnt signaling pathway. We found previously that in gut endocrine L-cell lines, TCF7L2 controls transcription of the proglucagon gene (gcg), which encodes the incretin hormone glucagon-like peptide-1 (GLP-1). Whereas peripheral GLP-1 stimulates insulin secretion, brain GLP-1 controls energy homeostasis through yet-to-be defined mechanisms. We aim to determine the metabolic effect of a functional knockdown of TCF7L2 by generating transgenic mice that express dominant-negative TCF7L2 (TCF7L2DN) specifically in gcg-expressing cells. The gcg-TCF7L2DN transgenic mice showed reduced gcg expression in their gut and brain, but not in pancreas. Defects in glucose homeostasis were observed in these mice, associated with attenuated plasma insulin levels in response to glucose challenge. The defect in glucose disposal was exacerbated with high-fat diet. Brain Wnt activity and feeding-mediated hypothalamic AMP-activated protein kinase (AMPK) repression in these mice were impaired. Peripheral injection of the cAMP-promoting agent forskolin increased brain β-cat Ser675 phosphorylation and brain gcg expression and restored feeding-mediated hypothalamic AMPK repression. We conclude that TCF7L2 and Wnt signaling control gut and brain gcg expression and glucose homeostasis and speculate that positive cross-talk between Wnt and GLP-1/cAMP signaling is an underlying mechanism for brain GLP-1 in exerting its metabolic functions.


Figures

FIG. 1.
FIG. 1.
Reduced intestinal and brain gcg expression in gcg-hTCF7L2DN transgenic mice. A: A schematic representation of the gcg-hTCF7L2DN transgene. The lack of the β-cat binding motif makes it function as a dominant-negative molecule (31). Quantitative RT-PCR shows reduced gcg levels in the gut (B) and brain (C), but not in the pancreas (D) in five founders of the transgenic mice (T1/Wt, n = 3/3; T2/Wt, n = 4/4; T3/Wt, n = 3/3; T4/Wt, n = 3/3; and T8/Wt, n = 3/3). This study assessed male mice only. *P < 0.05; **P < 0.01. E: A representative Northern blot shows reduced gcg mRNA levels in the distal ileum of T4 and T8 mice. F: Representative immunostaining shows reduced numbers of GLP-1–producing cells in the distal ileum of T4 mice. G: Percentage area of GLP-1–positive staining was calculated with the MacBiophotonics ImageJ program after the Aperio image scan of entire slide containing 5 cm of distal ileum. Representative immunostaining results show reduced GLP-1–positive cells in the distal ileum of T8 (H) and T3 (I) transgenic mice. Wt, wild type. (A high-quality digital representation of this figure is available in the online issue.)
FIG. 2.
FIG. 2.
The gcg-hTCF7L2DN transgenic mice show impaired glucose disposal. A: T3 and wild-type littermates were fed chow diet for 10 weeks. Blood glucose levels were determined in fasting and after feeding (n = 7 for both types). Similar observations were made for the T4 transgenic mice. B: The T3 mice show an attenuated insulin secretion in response to feeding and a trend of elevated fasting plasma insulin levels (n = 4 for both groups of mice, similar results were obtained for T4 transgenic mice and littermate controls). Plasma total (C) and active (D) GLP-1 levels were determined with the Mesoscale ELISA kits (n = 4 for both the T3 mice and the control group, similar results were obtained for the T4 mice and controls). E: A representative IPGTT result for T4 and their wild-type littermates fed with high-fat diet for 8 weeks (n = 4 for each group). F: A representative insulin tolerance test result for T4 (n = 5) vs. wild-type littermates (n = 5) 12 weeks after high-fat diet feeding. Western blotting shows impaired responses to IP insulin injection (1 units/kg body weight) in PKB Ser473 phosphorylation in fat tissue (G) and liver (H) in T4 mice after 12 weeks of high-fat diet feeding. Animals were killed 30 min after IP insulin injection. Representative blots for two independent assessments. *P < 0.05; **P < 0.01. Tg, transgenic; Wt, wild type. (A high-quality color representation of this figure is available in the online issue.)
FIG. 3.
FIG. 3.
TCF7L2 controls gcg expression in the mouse neuronal cell line mHypoE-20/2. A: Immunostaining shows the coexpression of TCF7L2 and GLP-1 in the brainstem of an 8-week-old male FVB mouse. B: RT-PCR shows the detection of TCF7, TCF7L1, and TCF7L2 mRNAs in the mouse brain (liver tissue is a control; primer sequences are shown in Table 1). C: Immunostaining shows GLP-1 expression in the mouse brain mHypoE-20/2 cell line (20/2). D: G2S-LUC expression was stimulated by 4-h lithium (Li; 10 mmol/L) or forskolin and IBMX (F/I; 10 μmol/L each) treatment in mHypoE-20/2 cells. E: Western blotting shows that TCF7L2 siRNA (TCF) but not the scrambled siRNA (S) blocked TCF7L2 expression in mHypoE-20/2 cells (nucleotide sequences of the siRNA are shown in Supplementary Fig. 5). F: Knockdown of TCF7L2 led to a reduced gcg mRNA level (representative RT-PCR result). A mouse distal Ileum (ileum) sample serves as the control for RT-PCR. G: Forskolin and IBMX (10 μmol/L each) treatment shows a temporary stimulation of β-cat S675 phosphorylation in the mHypoE-20/2 cell line. Expressing TCF7L2DN (tagged with mCherry, red) blocked GLP-1 production in gut GLUTag (H) and brain mHypoE-20/2 (20/2) (I) cell lines. The two cells lines were transfected with TCF7L2DN and Tet3G for 24 h, followed by doxycycline (5 ng/mL) treatment for another 24 h. Immunostaining shows that cells express TCF7L2DN (red) do not express GLP-1 (green). **P < 0.01; ***P < 0.001. (A high-quality digital representation of this figure is available in the online issue.)
FIG. 4.
FIG. 4.
cAMP elevation increases brain hypothalamic neuron β-cat Ser675 phosphorylation. Peripheral forskolin injection (F/I) (5 mg/kg) increased gut gcg mRNA expression (A) and CREB phosphorylation (Ser133) in hypothalamic neurons (B). C: Peripheral forskolin or lithium injection increased brainstem gcg mRNA levels (a representative RT-PCR, n = 3 for each group). C, control; LiCl, lithium chloride; F, forskolin. D: Forskolin stimulated brain β-cat Ser675 phosphorylation. A T4 transgenic mouse and a wild-type littermate (male, at age of 12 weeks) were killed. Brain hypothalamus tissues were taken for making primary cultures. The cells were treated with 10 μmol/L forskolin and 10 μmol/L IBMX for indicated times before being harvested for Western blotting, with indicated antibody. E: Exendin-4 (Ex-4; 20 nmol/L) treatment increased CREB and β-cat phosphorylation in the brain hypothalamic neurons. *P < 0.05. Tg, transgenic; Wt, wild type.
FIG. 5.
FIG. 5.
Consecutive IP forskolin injection in gcg-TCF7L2DN mice increased hypothalamic β-cat S675 phosphorylation, associated with increased c-Myc and cyclin D1 levels. T4 transgenic mice were IP injected with forskolin (2 mg/kg, 5 days) for 5 days (at 1:00 pm each day), followed by taking the hypothalamic neurons for Western blotting against Ser675 β-cat (A) or c-Myc and cyclin D1 (B). *P < 0.05.
FIG. 6.
FIG. 6.
Consecutive IP forskolin injection in gcg-TCF7L2DN mice restored feeding-mediated repression of AMPK. A: Refeeding led to inhibited hypothalamic AMPK in the wild-type but not the T4 transgenic mice (top and middle panels), whereas consecutive IP forskolin injection restored this inhibitory effect of refeeding. Representative blots for three mice in each of the three groups. n = 6 for each of the three groups. B–D: Densitometry analyses of A. E: Forskolin treatment inhibited AMPK activity in the brain neuronal cell line mHypoE-20/2.
FIG. 7.
FIG. 7.
A diagram shows the existence of positive feedback between the Wnt and GLP-1/cAMP signaling pathways in the brainstem and hypothalamus. In the brainstem, β-cat/TCF7L2 positively regulates gcg expression and the production of GLP-1, which inhibits food intake at least partially by attenuating hypothalamic AMPK activity (26). GLP-1 also stimulates brain Wnt activity via increasing β-cat Ser675 phosphorylation and, possibly, TCF7L2 production. In the brainstem, this leads to increased gcg expression (positive feedback), whereas in hypothalamic neurons this is among the anorectic effects of GLP-1. How the hypothalamic Wnt activation modulates peripheral glucose homeostasis and insulin signaling is currently unknown. (A high-quality color representation of this figure is available in the online issue.)

Comment in

Similar articles

Cited by

References

    1. Grant SF, Thorleifsson G, Reynisdottir I, et al. Variant of transcription factor 7-like 2 (TCF7L2) gene confers risk of type 2 diabetes. Nat Genet 2006;38:320–323 - PubMed
    1. Savic D, Ye H, Aneas I, Park SY, Bell GI, Nobrega MA. Alterations in TCF7L2 expression define its role as a key regulator of glucose metabolism. Genome Res 2011;21:1417–1425 - PMC - PubMed
    1. Osmark P, Hansson O, Jonsson A, Rönn T, Groop L, Renström E. Unique splicing pattern of the TCF7L2 gene in human pancreatic islets. Diabetologia 2009;52:850–854 - PubMed
    1. Prokunina-Olsson L, Welch C, Hansson O, et al. Tissue-specific alternative splicing of TCF7L2. Hum Mol Genet 2009;18:3795–3804 - PMC - PubMed
    1. Prokunina-Olsson L, Hall JL. Evidence for neuroendocrine function of a unique splicing form of TCF7L2 in human brain, islets and gut. Diabetologia 2010;53:712–716 - PMC - PubMed

Publication types

MeSH terms