

Increased memory differentiation is associated with decreased polyfunctionality for HIV but not for cytomegalovirus-specific CD8+ T cells
- PMID: 22966086
- PMCID: PMC3466366
- DOI: 10.4049/jimmunol.1201488
Increased memory differentiation is associated with decreased polyfunctionality for HIV but not for cytomegalovirus-specific CD8+ T cells
Abstract
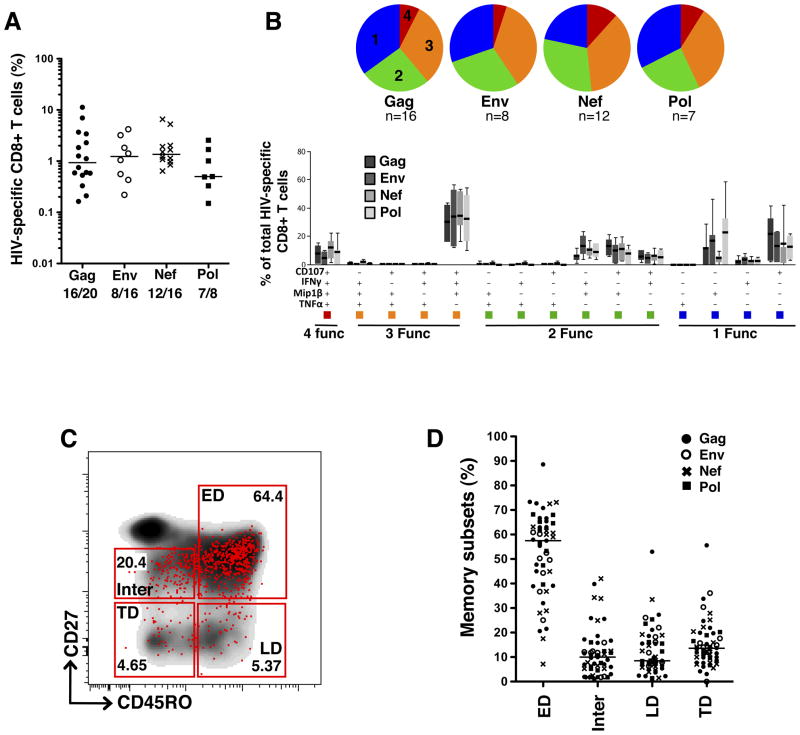
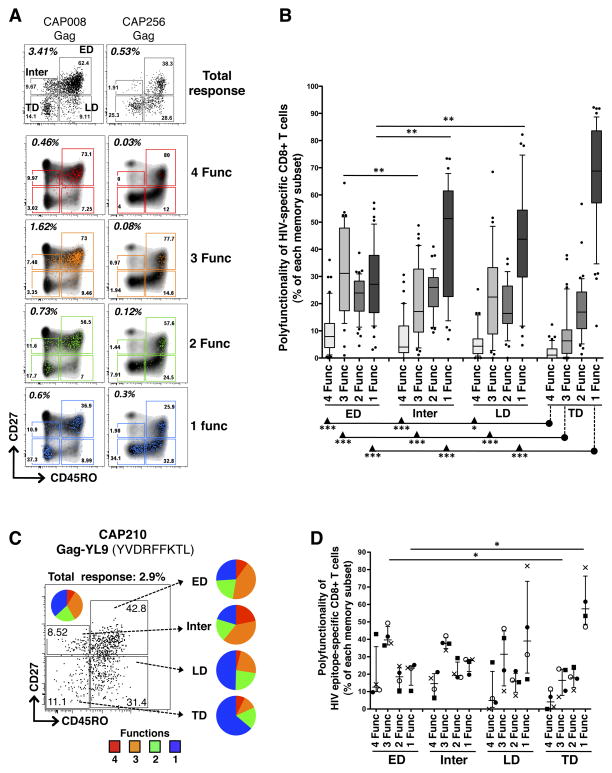
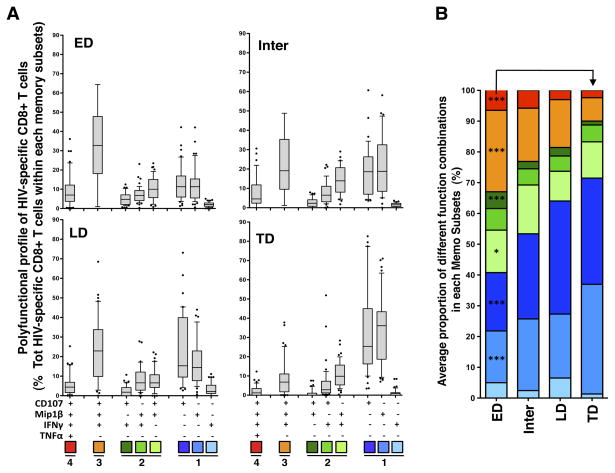
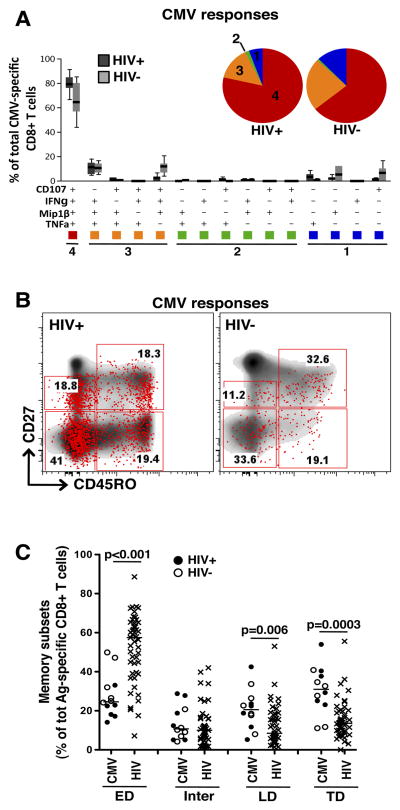
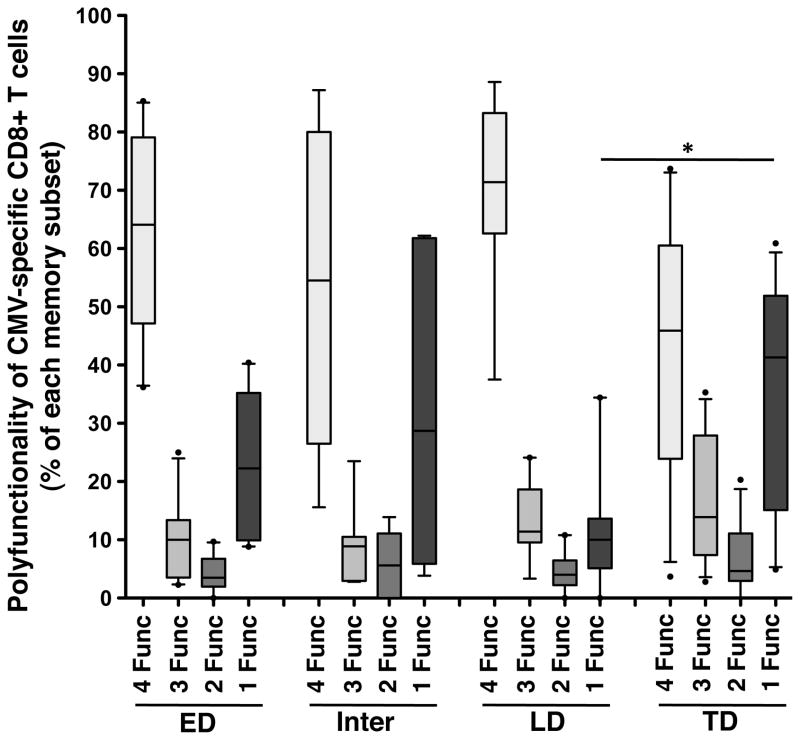
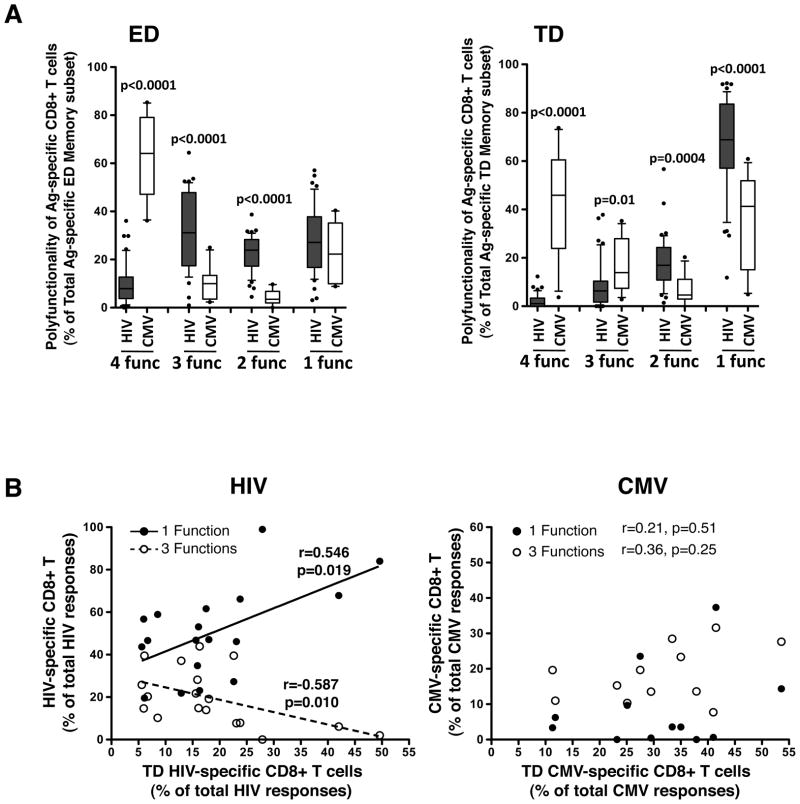
The generation of polyfunctional CD8(+) T cells, in response to vaccination or natural infection, has been associated with improved protective immunity. However, it is unclear whether the maintenance of polyfunctionality is related to particular cellular phenotypic characteristics. To determine whether the cytokine expression profile is linked to the memory differentiation stage, we analyzed the degree of polyfunctionality of HIV-specific CD8(+) T cells within different memory subpopulations in 20 antiretroviral therapy-naive HIV-1-infected individuals at ∼34 wk postinfection. These profiles were compared with CMV-specific CD8(+) T cell responses in HIV-uninfected control subjects and in individuals chronically infected with HIV. Our results showed that the polyfunctional abilities of HIV-specific CD8(+) T cells differed according to their memory phenotype. Early-differentiated cells (CD45RO(+)CD27(+)) exhibited a higher proportion of cells positive for three or four functions (p < 0.001), and a lower proportion of monofunctional cells (p < 0.001) compared with terminally differentiated (TD; CD45RO(-)CD27(-)) HIV-specific CD8(+) T cells. The majority of TD HIV-specific CD8(+) T cells were monofunctional (median 69% [interquartile range: 57-83]), producing predominantly CD107a or MIP1β. Moreover, proportions of HIV-specific monofunctional CD8(+) T cells positively associated with proportions of TD HIV-specific CD8(+) T cells (p = 0.019, r = 0.54). In contrast, CMV-specific CD8(+) T cell polyfunctional capacities were similar across all memory subpopulations, with terminally and early-differentiated cells endowed with comparable polyfunctionality. Overall, these data show that the polyfunctional abilities of HIV-specific CD8(+) T cells are influenced by the stage of memory differentiation, which is not the case for CMV-specific responses.
Conflict of interest statement
Disclosure: The authors have no conflict of interest
Figures
Similar articles
-
Impact of HIV on CD8+ T cell CD57 expression is distinct from that of CMV and aging.PLoS One. 2014 Feb 27;9(2):e89444. doi: 10.1371/journal.pone.0089444. eCollection 2014. PLoS One. 2014. PMID: 24586783 Free PMC article.
-
Phenotype, Polyfunctionality, and Antiviral Activity of in vitro Stimulated CD8+ T-Cells From HIV+ Subjects Who Initiated cART at Different Time-Points After Acute Infection.Front Immunol. 2018 Oct 23;9:2443. doi: 10.3389/fimmu.2018.02443. eCollection 2018. Front Immunol. 2018. PMID: 30405632 Free PMC article.
-
HIV-1-specific memory CD4+ T cells are phenotypically less mature than cytomegalovirus-specific memory CD4+ T cells.J Immunol. 2004 Feb 15;172(4):2476-86. doi: 10.4049/jimmunol.172.4.2476. J Immunol. 2004. PMID: 14764720
-
Everything in its right place: resident memory CD8+ T cell immunosurveillance of HIV infection.Curr Opin HIV AIDS. 2019 Mar;14(2):93-99. doi: 10.1097/COH.0000000000000523. Curr Opin HIV AIDS. 2019. PMID: 30520744 Review.
-
Jigsaw falling into place: A review and perspective of lymphoid tissue CD8+ T cells and control of HIV.Mol Immunol. 2020 Aug;124:42-50. doi: 10.1016/j.molimm.2020.05.016. Epub 2020 Jun 8. Mol Immunol. 2020. PMID: 32526556 Free PMC article. Review.
Cited by
-
Cytomegalovirus-Responsive CD8+ T Cells Expand After Solid Organ Transplantation in the Absence of CMV Disease.Am J Transplant. 2017 Aug;17(8):2045-2054. doi: 10.1111/ajt.14227. Epub 2017 Mar 13. Am J Transplant. 2017. PMID: 28199780 Free PMC article.
-
Latent Cytomegalovirus (CMV) Infection Does Not Detrimentally Alter T Cell Responses in the Healthy Old, But Increased Latent CMV Carriage Is Related to Expanded CMV-Specific T Cells.Front Immunol. 2017 Jun 26;8:733. doi: 10.3389/fimmu.2017.00733. eCollection 2017. Front Immunol. 2017. PMID: 28694811 Free PMC article.
-
Early skewed distribution of total and HIV-specific CD8+ T-cell memory phenotypes during primary HIV infection is related to reduced antiviral activity and faster disease progression.PLoS One. 2014 Aug 5;9(8):e104235. doi: 10.1371/journal.pone.0104235. eCollection 2014. PLoS One. 2014. PMID: 25093660 Free PMC article.
-
Reduced frequencies of polyfunctional CMV-specific T cell responses in infants with congenital CMV infection.J Clin Immunol. 2015 Apr;35(3):289-301. doi: 10.1007/s10875-015-0139-3. Epub 2015 Feb 25. J Clin Immunol. 2015. PMID: 25712611 Free PMC article.
-
T cell receptor-targeted immunotherapeutics drive selective in vivo HIV- and CMV-specific T cell expansion in humanized mice.J Clin Invest. 2021 Dec 1;131(23):e141051. doi: 10.1172/JCI141051. J Clin Invest. 2021. PMID: 34673568 Free PMC article.
References
-
- Schmitz JE, Kuroda MJ, Santra S, Sasseville VG, Simon MA, Lifton MA, Racz P, Tenner-Racz K, Dalesandro M, Scallon BJ, Ghrayeb J, Forman MA, Montefiori DC, Rieber EP, Letvin NL, Reimann KA. Control of viremia in simian immunodeficiency virus infection by CD8+ lymphocytes. Science (New York, NY. 1999;283:857–860. - PubMed
-
- Betts MR, Ambrozak DR, Douek DC, Bonhoeffer S, Brenchley JM, Casazza JP, Koup RA, Picker LJ. Analysis of total human immunodeficiency virus (HIV)-specific CD4(+) and CD8(+) T-cell responses: relationship to viral load in untreated HIV infection. Journal of virology. 2001;75:11983–11991. - PMC - PubMed
-
- Addo MM, Yu XG, Rathod A, Cohen D, Eldridge RL, Strick D, Johnston MN, Corcoran C, Wurcel AG, Fitzpatrick CA, Feeney ME, Rodriguez WR, Basgoz N, Draenert R, Stone DR, Brander C, Goulder PJ, Rosenberg ES, Altfeld M, Walker BD. Comprehensive epitope analysis of human immunodeficiency virus type 1 (HIV-1)-specific T-cell responses directed against the entire expressed HIV-1 genome demonstrate broadly directed responses, but no correlation to viral load. Journal of virology. 2003;77:2081–2092. - PMC - PubMed
Publication types
MeSH terms
Substances
Grants and funding
LinkOut - more resources
Full Text Sources
Research Materials
