

Parasite invasion following host reintroduction: a case study of Yellowstone's wolves
- PMID: 22966139
- PMCID: PMC3427562
- DOI: 10.1098/rstb.2011.0369
Parasite invasion following host reintroduction: a case study of Yellowstone's wolves
Abstract
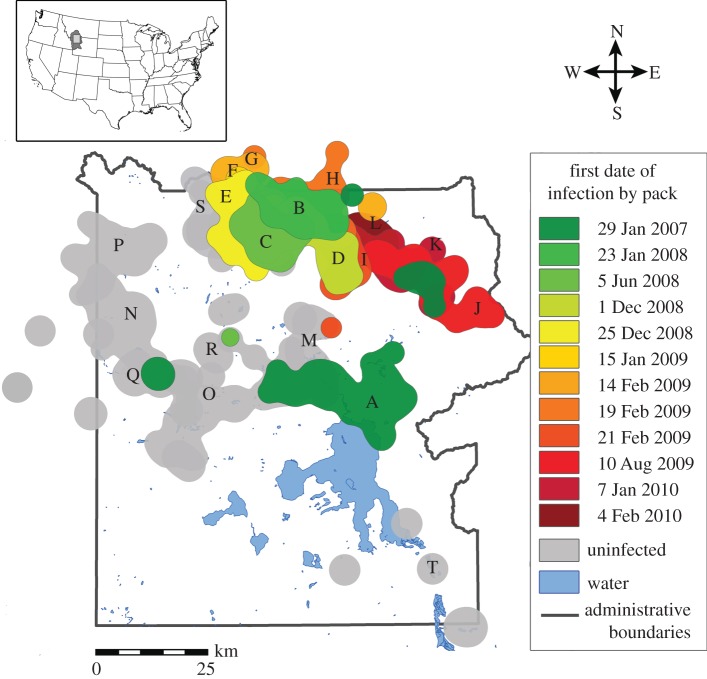
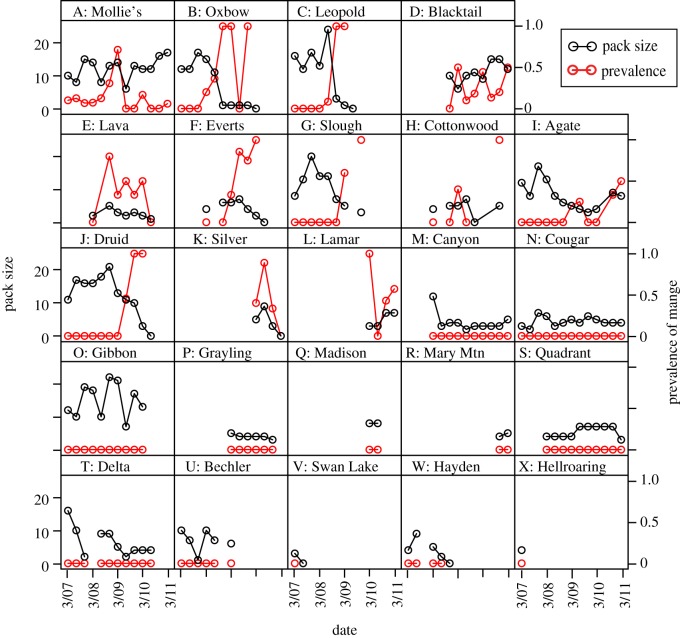
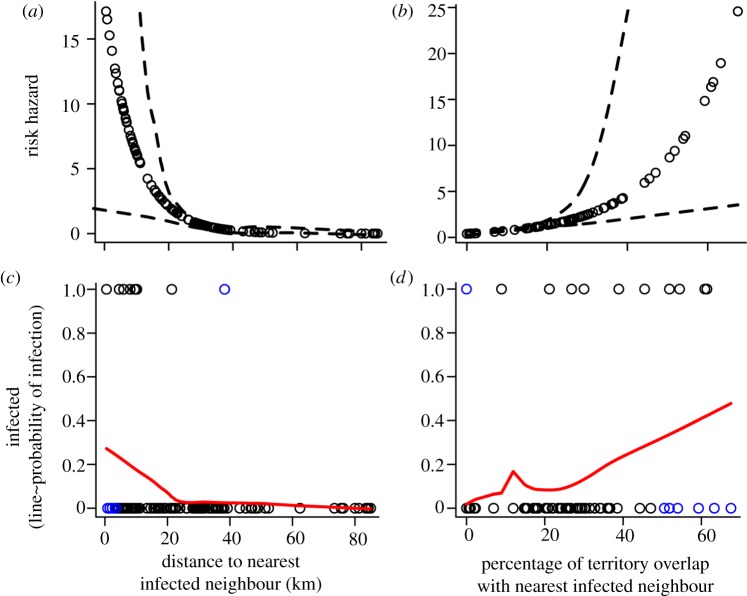
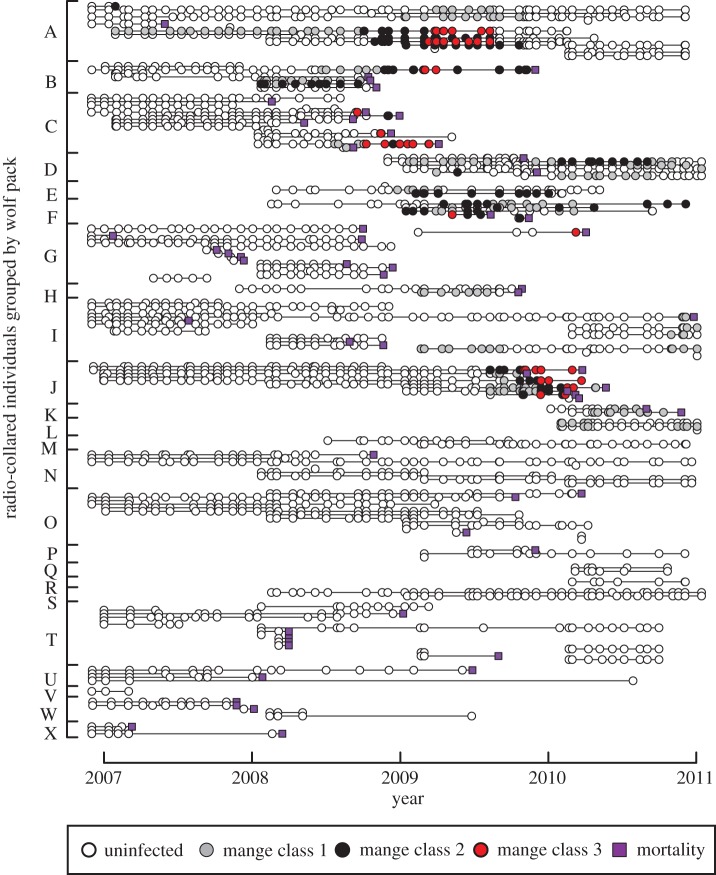
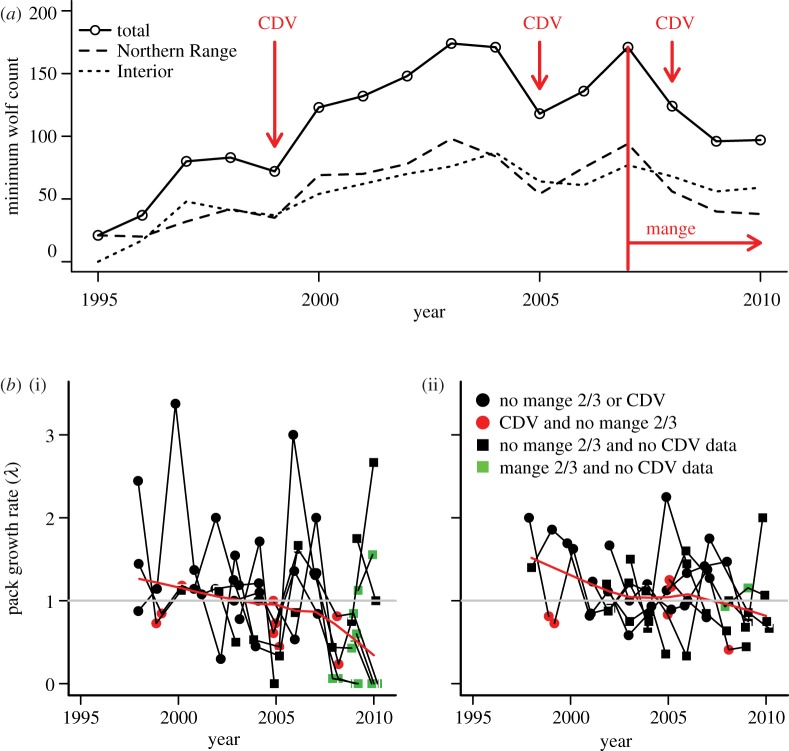
Wildlife reintroductions select or treat individuals for good health with the expectation that these individuals will fare better than infected animals. However, these individuals, new to their environment, may also be particularly susceptible to circulating infections and this may result in high morbidity and mortality, potentially jeopardizing the goals of recovery. Here, using the reintroduction of the grey wolf (Canis lupus) into Yellowstone National Park as a case study, we address the question of how parasites invade a reintroduced population and consider the impact of these invasions on population performance. We find that several viral parasites rapidly invaded the population inside the park, likely via spillover from resident canid species, and we contrast these with the slower invasion of sarcoptic mange, caused by the mite Sarcoptes scabiei. The spatio-temporal patterns of mange invasion were largely consistent with patterns of host connectivity and density, and we demonstrate that the area of highest resource quality, supporting the greatest density of wolves, is also the region that appears most susceptible to repeated disease invasion and parasite-induced declines. The success of wolf reintroduction appears not to have been jeopardized by infectious disease, but now shows signs of regulation or limitation modulated by parasites.
Figures
Similar articles
-
Sarcoptic mange in the Scandinavian wolf Canis lupus population.BMC Vet Res. 2016 Jul 27;12(1):156. doi: 10.1186/s12917-016-0780-y. BMC Vet Res. 2016. PMID: 27459965 Free PMC article.
-
Concomitance and interactions of pathogens in the Iberian wolf (Canis lupus).Res Vet Sci. 2015 Aug;101:22-7. doi: 10.1016/j.rvsc.2015.05.010. Epub 2015 May 24. Res Vet Sci. 2015. PMID: 26267084
-
Sarcoptic mange found in wolves in the Rocky Mountains in western United States.J Wildl Dis. 2010 Oct;46(4):1120-5. doi: 10.7589/0090-3558-46.4.1120. J Wildl Dis. 2010. PMID: 20966263
-
The emergence of sarcoptic mange in Australian wildlife: an unresolved debate.Parasit Vectors. 2016 Jun 2;9(1):316. doi: 10.1186/s13071-016-1578-2. Parasit Vectors. 2016. PMID: 27255333 Free PMC article. Review.
-
Sarcoptic mange in wombats-A review and future research directions.Transbound Emerg Dis. 2018 Apr;65(2):399-407. doi: 10.1111/tbed.12770. Epub 2017 Nov 18. Transbound Emerg Dis. 2018. PMID: 29150905 Review.
Cited by
-
A metapopulation model of social group dynamics and disease applied to Yellowstone wolves.Proc Natl Acad Sci U S A. 2021 Mar 9;118(10):e2020023118. doi: 10.1073/pnas.2020023118. Proc Natl Acad Sci U S A. 2021. PMID: 33649227 Free PMC article.
-
Sarcoptic mange severity is associated with reduced genomic variation and evidence of selection in Yellowstone National Park wolves (Canis lupus).Evol Appl. 2020 Sep 20;14(2):429-445. doi: 10.1111/eva.13127. eCollection 2021 Feb. Evol Appl. 2020. PMID: 33664786 Free PMC article.
-
International meeting on sarcoptic mange in wildlife, June 2018, Blacksburg, Virginia, USA.Parasit Vectors. 2018 Aug 3;11(1):449. doi: 10.1186/s13071-018-3015-1. Parasit Vectors. 2018. PMID: 30075742 Free PMC article.
-
Density independent decline from an environmentally transmitted parasite.Biol Lett. 2023 Aug;19(8):20230169. doi: 10.1098/rsbl.2023.0169. Epub 2023 Aug 23. Biol Lett. 2023. PMID: 37607579 Free PMC article.
-
Gastrointestinal helminths of gray wolves (Canis lupus lupus) from Sweden.Parasitol Res. 2018 Jun;117(6):1891-1898. doi: 10.1007/s00436-018-5881-z. Epub 2018 Apr 25. Parasitol Res. 2018. PMID: 29696393
References
-
- Tilman D., May R. M., Lehman C. L., Nowak M. A. 1994. Habitat destruction and the extinction debt. Nature 371, 65–6610.1038/371065a0 (doi:10.1038/371065a0) - DOI - DOI
-
- Maclean I. M. D., Wilson R. J. 2011. Recent ecological responses to climate change support predictions of high extinction risk. Proc. Natl Acad. Sci. USA 108, 12 337–12 34210.1073/pnas.1017352108 (doi:10.1073/pnas.1017352108) - DOI - DOI - PMC - PubMed
-
- Worm B., et al. 2009. Rebuilding global fisheries. Science 325, 578–58510.1126/science.1173146 (doi:10.1126/science.1173146) - DOI - DOI - PubMed
-
- Rosser A. M., Mainka S. A. 2002. Overexploitation and species extinctions. Conserv. Biol. 16, 584–58610.1046/j.1523-1739.2002.01635.x (doi:10.1046/j.1523-1739.2002.01635.x) - DOI - DOI
-
- Cardillo M., Mace G. M., Jones K. E., Bielby J., Bininda-Emonds O. R. P., Sechrest W., Orme C. D. L., Purvis A. 2005. Multiple causes of high extinction risk in large mammal species. Science 309, 1239–124110.1126/science.1116030 (doi:10.1126/science.1116030) - DOI - DOI - PubMed
Publication types
MeSH terms
LinkOut - more resources
Full Text Sources
Medical
