. 2012 Sep;237(9):1068-83.
doi: 10.1258/ebm.2012.012052. Epub 2012 Sep 10.

Elevated extracellular glucose and uncontrolled type 1 diabetes enhance NFAT5 signaling and disrupt the transverse tubular network in mouse skeletal muscle

Affiliations

Elevated extracellular glucose and uncontrolled type 1 diabetes enhance NFAT5 signaling and disrupt the transverse tubular network in mouse skeletal muscle

Erick O Hernández-Ochoa et al. Exp Biol Med (Maywood). 2012 Sep.

Erratum in

  • Exp Biol Med (Maywood). 2012 Nov 1;237(11):1368

Abstract

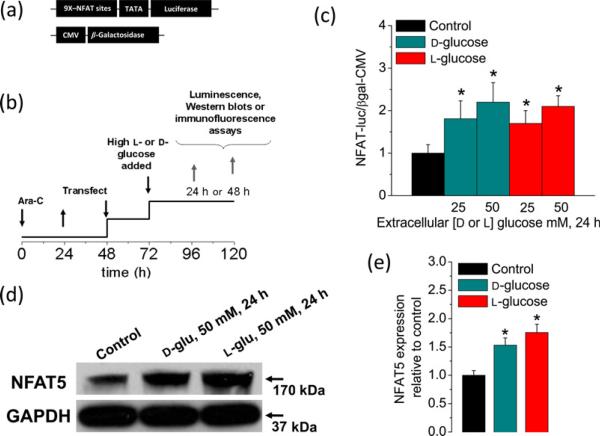
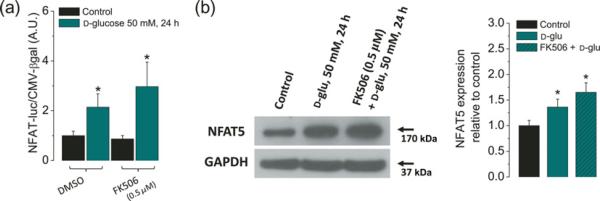
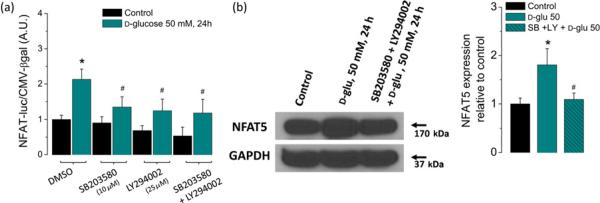
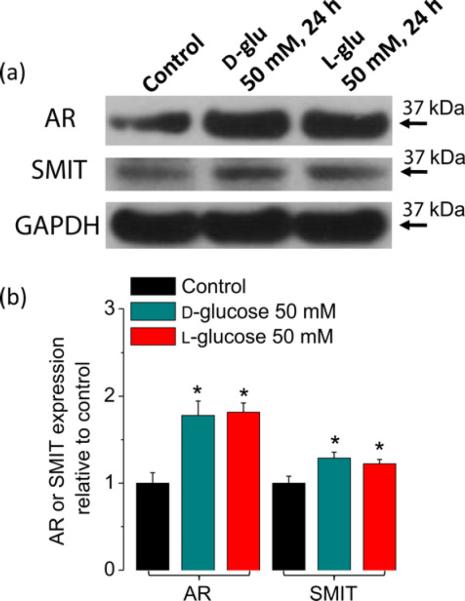
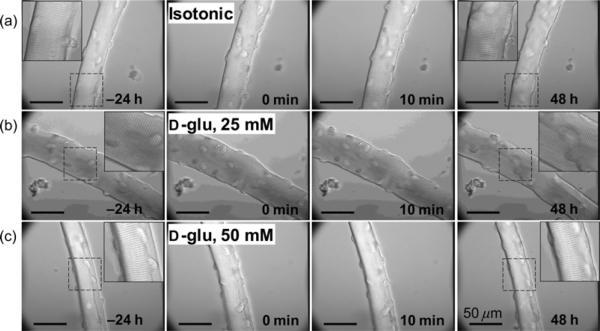
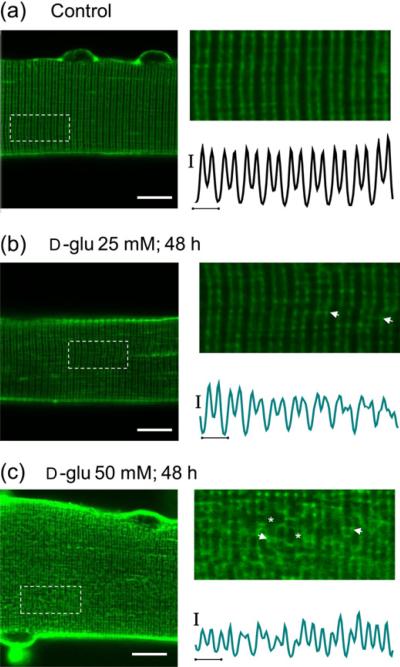
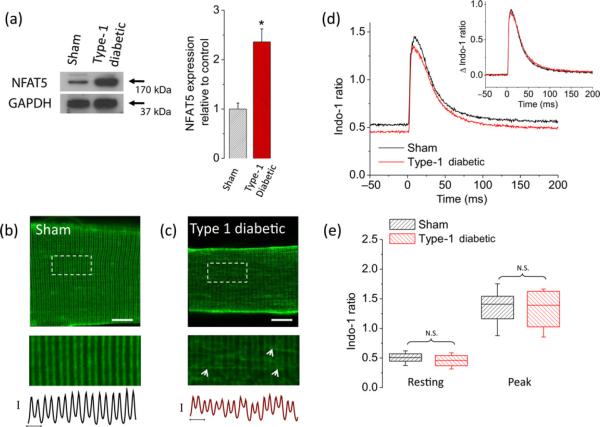
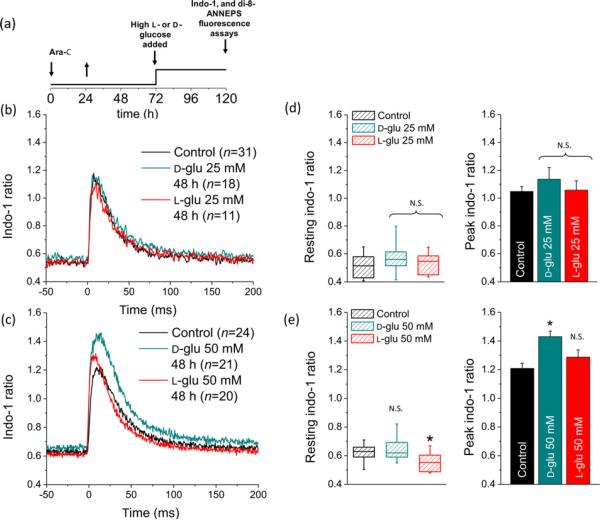
The transcription factor nuclear factor of activated T-cells 5 (NFAT5) is a key protector from hypertonic stress in the kidney, but its role in skeletal muscle is unexamined. Here, we evaluate the effects of glucose hypertonicity and hyperglycemia on endogenous NFAT5 activity, transverse tubular system morphology and Ca(2+) signaling in adult murine skeletal muscle fibers. We found that exposure to elevated glucose (25-50 mmol/L) increased NFAT5 expression and nuclear translocation, and NFAT-driven transcriptional activity. These effects were insensitive to the inhibition of calcineurin A, but sensitive to both p38α mitogen-activated protein kinases and phosphoinositide 3-kinase-related kinase inhibition. Fibers exposed to elevated glucose exhibited disrupted transverse tubular morphology, characterized by swollen transverse tubules and an increase in longitudinal connections between adjacent transverse tubules. Ca(2+) transients elicited by a single, brief electric field stimuli were increased in amplitude in fibers challenged by elevated glucose. Muscle fibers from type 1 diabetic mice exhibited increased NFAT5 expression and transverse tubule disruptions, but no differences in electrically evoked Ca(2+) transients. Our results suggest the hypothesis that these changes in skeletal muscle could play a role in the pathophysiology of acute and severe hyperglycemic episodes commonly observed in uncontrolled diabetes.


Figures

Figure 1
Figure 1
Sustained elevation in extracellular glucose enhances NFAT-dependent transcriptional activity and NFAT5 expression. (a) Schematic representation of the reporters used in this study. (b) Protocol used for experiments illustrated also in Figures 2–5. After plating, FDB fibers were treated with ara-C for 24 h, then ara-C was washed out. Then, after 48 h, plated fibers were co-transfected with adenovirus containing NFAT-driven luciferase and CMV-driven β-galactosidase reporters. Transfection was not performed in fibers used for Western blot and immunofluorescence assays. Beginning one day after transfection, fibers were maintained in control and isotonic (5.56 mmol/L d-glucose; 288 mOsm/kg) media or in high d-or l-glucose medium (25–50 mmol/L; 308–336 mOsm/kg) for 24–48 h. After this time, cells were homogenated and assayed for luciferase and β-galactosidase activities or Western blot. (c) NFAT-dependent transcriptional activity was enhanced by increasing d-or l-glucose concentrations (for 24 h). Mean ± SE of four independent experiments (four mice per group) are shown. (d) Western blot analysis of whole-cell homogenates prepared from FDB fibers cultured in control isotonic media or in high d-or l-glucose (50 mmol/L) media for 24 h by using NFAT5 antibody. The blot is representative of three independent experiments (three mice per group). (e) Quantification of Western blotdata indicates a substantial increase of NFAT5 expression by elevated d-or l-glucose. *Indicates P< 0.05 compared with control. NFAT, nuclear factor of activated T-cell; FDB, flexor digitorum brevis; ara-C, cytosine β-d-arabinofuranoside; CMV cytomegalovirus; GAPDH, glyceraldehyde-3-phosphate dehydrogenase. (A color version of this figure is available in the online journal)
Figure 2
Figure 2
High glucose-dependent activation of the NFAT-luciferase reporter and NFAT5 expression are insensitive to the calcineurin-A inhibitor FK506. Fibers were transfected as in the protocol indicated in Figure 1a. One day after transfection, fibers were transferred to isotonic or high-glucose (50 mmol/L) media with DMSO (0.5% v/v) or with FK506 (0.5 μmol/L), a calcineurin-A inhibitor, during 24 h. (a) Luciferase activity driven by NFAT normalized to β-galactosidase activity driven by CMV relative to control fibers. Mean ± S.E. of four independent experiments (four mice per group) is shown. (b) Western blot analysis of whole cell homogenates prepared from FDB fibers cultured in control isotonic media or in high d-glucose (50 mmol/L) media with DMSO (0.5% v/v) or with FK506 (0.5 μmol/L) for 24 h by using NFAT5 antibody. The blot is representative of three independent experiments (three mice per group). The bar plot is the result of triplicate experiments, showing that the increase on NFAT5 expression induced by elevated glucose is insensitive to the calcineurin-A inhibitor FK506. *Indicates P< 0.05 compared with control. NFAT, nuclear factor of activated T-cell; DMSO, dimethyl sulfoxide; CMV, cytomegalovirus; FDB, flexor digitorum brevis; GAPDH, glyceraldehyde-3-phosphate dehydrogenase. (A color version of this figure is available in the online journal)
Figure 3
Figure 3
High glucose-dependent activation of the NFAT-luciferase reporter and NFAT5 expression are sensitive to inhibitors of stress kinases p38α and PIKK. FDB fibers were transfected as in Figure 1a. One day after transfection, fibers were transferred to isotonic or high-glucose (50 mmol/L) media with DMSO (0.5% v/v) or with SB203580 (10 μmol/L; a p38α inhibitor), LY2940002 (25 μmol/L; a PIKK inhibitor) or both (SB203580 + LY2940002) during 24 h. (a) Luciferase activity driven by NFAT normalized to β-galactosidase activity driven by CMV relative to control fibers. Mean ± S.E of three independent experiments is shown. (b) Western blot analysis of whole cell homogenates prepared from FDB fibers cultured in control isotonic media or in high d-glucose (50 mmol/L) media with DMSO (0.5% v/v) or with the combination of SB203580 + LY2940002 for 24 h by using NFAT5 antibody. The blot is representative of three independent experiments (three mice per group). The bar plot indicates that the increase on NFAT5 expression induced by elevated glucose is sensitive to inhibitors of stress kinases p38α and PIKK. *Indicates P< 0.05 compared with control; #P< 0.05 compared with fibers exposed to d-glucose without inhibitors. NFAT, nuclear factor of activated T-cell; DMSO, dimethyl sulfoxide; FDB, flexor digitorum brevis; PIKK, phosphoinositide 3-kinase-related kinase; CMV, cytomegalovirus; GAPDH, glyceraldehyde-3-phosphate dehydrogenase. (A color version of this figure is available in the online journal)
Figure 4
Figure 4
Sustained elevation in extracellular glucose enhances NFAT5 nuclear translocation. Following the protocol described in Figure 1a, at 72 h after plating, fibers were transferred to isotonic or high d-glucose medium for 24 h; after this time, cells were fixed and assayed by immunofluorescence using a monoclonal NFAT5 antibody. (a and b) Representation of confocal images illustrating the distribution of NFAT5 (top panels) and DAPI staining (middle panels) in FDB fibers exposed to isotonic (a) or elevated (50 mmol/L) D-glucose (b). Merged images are shown in bottom panels. Asterisks in top panels (a) and (b) indicate a distinct pattern of fluorescent foci (1–3 foci per nucleus of about 1–3 μm in diameter). Scale bar: 5 μm. (c) Quantification of average nuclear translocation in control (n = 14 fibers, three mice) and d-glucose-exposed fibers (n = 14 fibers, three mice), measured as the ratio of nuclear/cytosolic NFAT5-Alexa-488 fluorescence measured in the regions of interest illustrated in (a) and (b). *Indicates P < 0.05 compared with control. NFAT5, nuclear factor of activated T-cell; DAPI, 4',6-diamidino-2-phenylindole; FDB, flexor digitorum brevis. (A color version of this figure is available in the online journal)
Figure 5
Figure 5
Activation of NFAT5-dependent osmoprotective genes after an elevation in extracellular d-glucose. (a) Western blot analysis of whole-cell homogenates prepared from FDB fibers cultured in control isotonic or in elevated extracellular d-glucose (50 mmol/L) media for 24 h using AR, SMIT and GAPDH antibodies. The blots are representative of three independent experiments (three mice per group). (b) Quantification of Western blot data indicates a substantial increase of AR and a more modest increase of SMIT by elevated d-glucose. Data are the mean ± SE. *Indicates P < 0.05 compared with control. NFAT5, nuclear factor of activated T-cells 5; FDB, flexor digitorum brevis; AR, aldose reductase; SMIT, sodium/myo-inositol transporter; GAPDH, glyceraldehyde-3-phosphate dehydrogenase. (A color version of this figure is available in the online journal)
Figure 6
Figure 6
Fibers exposed to elevated glucose do not exhibit major changes in gross morphology. Representative differential interference contrast microscopy images from a 72-h time-lapse experiment from a control fiber maintained in isotonic control (5.56 mmol/L d-glucose) media (a), from another fiber treated with 25 mmol/L added d-glucose (b) and from another fiber treated with 50 mmol/L added d-glucose (c). Isotonic or elevated glucose-containing media changes were conducted at time 0. Scale bars: 50 μm. Fibers (10–14 fibers, three mice per condition) were able to resist the treatment with elevated glucose for up to 48 h without displaying any major disturbance in morphology
Figure 7
Figure 7
Transverse tubular system disruption accompanying d-glucose exposure. Confocal images of FDB muscle fibers maintained in isotonic control (5.56 mmol/L d-glucose) medium (a) (n = 22 fibers, three mice), 25 mmol/L d-glucose (b) (n = 36 fibers, three mice) and 50 mmol/L (c) (n = 28 fibers, three mice) for 48 h and then stained with di-8-ANEPPS (see protocol in Figure 9a). Scale bars: 10 μm. (a–c) Right panels, zoom-in versions of boxed regions indicated in left panels. Traces below zoom-in images are averaged fluorescence profiles across the box, vertical scale bar: 500 A.U.; horizontal scale bar: 2 μm. Di-8-ANEPPS staining reveals that the normally regular transverse-tubule morphology (a) is moderately affected in fibers exposed to 25 mmol/L d-glucose for 48 h (b), but is remarkably disrupted in fibers exposed to 50 mmol/L d-glucose for 48 h (c). The asterisks indicate places of transverse tubule dilation and the arrows indicate locations where adjacent transverse tubule appear to make close contact. FDB, flexor digitorum brevis; NFAT5, nuclear factor of activated T-cells 5; A.U., arbitrary units. (A color version of this figure is available in the online journal)
Figure 8
Figure 8
Fibers from type 1 diabetic mice display an increase in NFAT5 expression and transverse tubule system disruption but no changes in electrically evoked Ca2+ transients. (a) Left, Western blot analysis of whole cell homogenates prepared from TA muscles from sham, non-diabetic mice or from type 1 diabetic mice. The blot is representative of three independent experiments, three mice per condition. Right, quantification of Western blot data indicates a substantial increase of NFAT5 expression in type 1 diabetic mice. *Indicates P < 0.05 compared with sham, non-diabetic control. Representative confocal images of the transverse tubule morphology of FDB fibers isolated from sham, non-diabetic (b) (n = 30 fibers, four mice) and type 1 diabetic mice (c) (n = 30 fibers, four mice) and stained with di-8-ANEPPS. Scale bar: 20 μm. Bottom images are zoom-in versions of boxed regions indicated in panels (b) and (c). Traces below zoom-in images are averaged fluorescence profiles across the box, vertical scale bar: 500 A.U.; horizontal scale bar: 2 μm. Di-8-ANEPPS staining reveals that transverse tubule morphology is disrupted in fibers from diabetic mice. (d) Time course of electrically evoked Ca2+ transients, using the Ca2+ indicator indo-1, from single muscle fibers from sham, non-diabetic mice (black trace; n = 31 fibers, four mice) and from type 1 diabetic mice (red trace; n = 35 fibers, four mice). Inset, Δ indo-1 ratio (Δ indo-1 ratio = (indo-1 ratio) – (resting indo-1 ratio)), shows negligible differences in the amplitude and kinetics of electrically evoked Ca2+ transients from fibers isolated from type 1 diabetic mice when compared with sham, non-diabetic counterparts. (e) Box-plot summary of indo-1 ratio measurements at rest and peak; median indo-1 ratio values are shown by solid lines within each box on distribution plots. Box upper and lower limits represent the 75th and 25th percentiles, respectively; the extended lines indicate the 10th and 90th percentiles. No significant changes in resting or peak indo-1 ratio values were found in fibers from type 1 diabetic mice when compared with control counterparts. For experiments using FDB fibers from diabetic mice in panels (b)–(e), glucose in media was maintained at the same levels as found in vivo (average plasma glucose in type 1 diabetic mice was 22 mmol/L). One day after plating, FDB fibers from type 1 diabetic mice and sham, non-diabetic mice were stained with Di-8-ANEPPS or loaded with indo-1 AM (see Materials and methods) and then resting ratio and electrically evoked Ca2+ transients were measured. N.S., not significant; A.U., arbitrary units; NFAT5, nuclear factor of activated T-cells 5; FDB, flexor digitorum brevis; TA, tibialis anterior; GAPDH, glyceraldehyde-3-phosphate dehydrogenase. (A color version of this figure is available in the online journal)
Figure 9
Figure 9
Sustained elevated d-glucose enhances electrically evoked Ca2+ transients. (a) Time course of the experiments using di-8-ANEPPS and indo-1, also in Figure 7. After plating, FDB fibers were treated with ara-C for 24 h, then ara-C was washed out. Then, three days after plating, fibers were maintained in control isotonic (5.56 mmol/L d-glucose; 288 mOsm/kg) or in high d- or l-glucose (25–50 mmol/L; osmolality 308–336 mOsm/kg) medium for 24–48 h; after this time, cells were loaded/stained with Ca2+ indicator or with di-8-ANEPPS. (b) Time course of electrically evoked indo-1 transients in fibers maintained in control media (black trace; n = 31 fibers, six mice), 25 mmol/L d-glucose (cyan trace, n = 18 fibers, six mice) or 25 mmol/L l-glucose (red trace, n = 11 fibers, five mice). (c) Time course of electrically evoked indo-1 transients in fibers maintained in control media (black trace; n = 24 fibers, six mice), 50 mmol/L d-glucose (cyan trace; n = 21 fibers, eight mice) or 50 mmol/L l-glucose (red trace; n = 20 fibers, six mice) for 48 h. (d) Summary of rest and at peak indo-1 ratio measurements for fibers exposed to 25 mmol/L elevated glucose. (e) Summary of rest and at peak indo-1 ratio measurements for fibers exposed to 50 mmol/L elevated glucose. No significant changes in resting indo-1 ratio were found in fibers challenged with either 25 mmol/L (d, left) or 50 mmol/L (e, left) elevated d-glucose. l-glucose at 50 mmol/L induced a small but significant reduction in resting indo-1 ratio (e, left). In box plots, median indo-1 ratio values are shown by solid lines within each box, upper and lower limits represent the 75th and 25th percentiles, respectively; the extended lines indicate the 10th and 90th percentiles. No significant changes in peak indo-1 ratio were found in fibers challenged with 25 mmol/L d-or l-glucose-exposed fibers (d, right). Fibers exposed to 50 mmol/L d-glucose displayed a significantly larger action potential-induced Ca2+ transient (e, right). *Indicates P < 0.05 compared with control. N.S. not significant; FDB, flexor digitorum brevis; ara-C, cytosine β-d-arabinofuranoside. (A color version of this figure is available in the online journal)

Similar articles

Cited by

References

    1. Crabtree GR, Olson EN. NFAT signaling: choreographing the social lives of cells. Cell. 2002;109(Suppl):S67–79. - PubMed
    1. Rao A, Luo C, Hogan PG. Transcription factors of the NFAT family: regulation and function. Annu Rev Immunol. 1997;15:707–47. - PubMed
    1. Lopez-Rodriguez C, Aramburu J, Rakeman AS, Rao A. NFAT5, a constitutively nuclear NFAT protein that does not cooperate with Fos and Jun. Proc Natl Acad Sci USA. 1999;96:7214–9. - PMC - PubMed
    1. Miyakawa H, Woo SK, Dahl SC, Handler JS, Kwon HM. Tonicity-responsive enhancer binding protein, a rel-like protein that stimulates transcription in response to hypertonicity. Proc Natl Acad Sci USA. 1999;96:2538–42. - PMC - PubMed
    1. Ko BC, Turck CW, Lee KW, Yang Y, Chung SS. Purification, identification, and characterization of an osmotic response element binding protein. Biochem Biophys Res Commun. 2000;270:52–61. - PubMed

Publication types

MeSH terms