. 2012 Nov;32(22):4642-50.
doi: 10.1128/MCB.00906-12. Epub 2012 Sep 10.

Requirement for SNAPC1 in transcriptional responsiveness to diverse extracellular signals

Affiliations

Requirement for SNAPC1 in transcriptional responsiveness to diverse extracellular signals

David Baillat et al. Mol Cell Biol. 2012 Nov.

Abstract

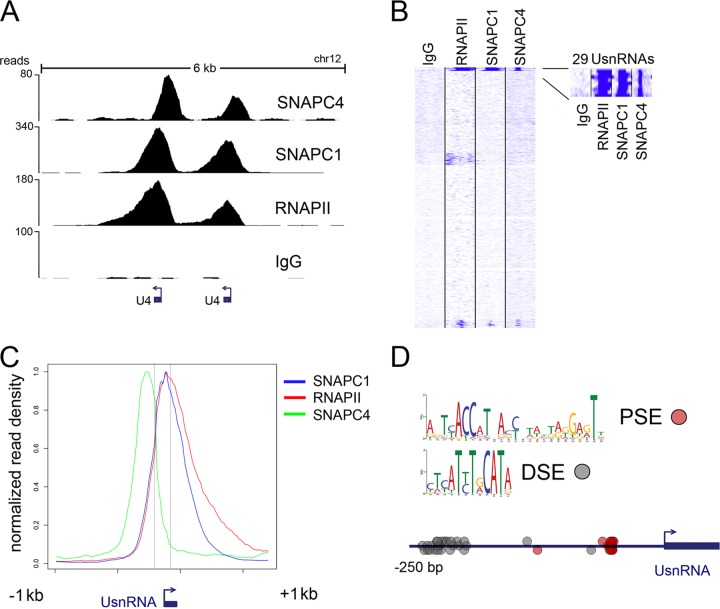
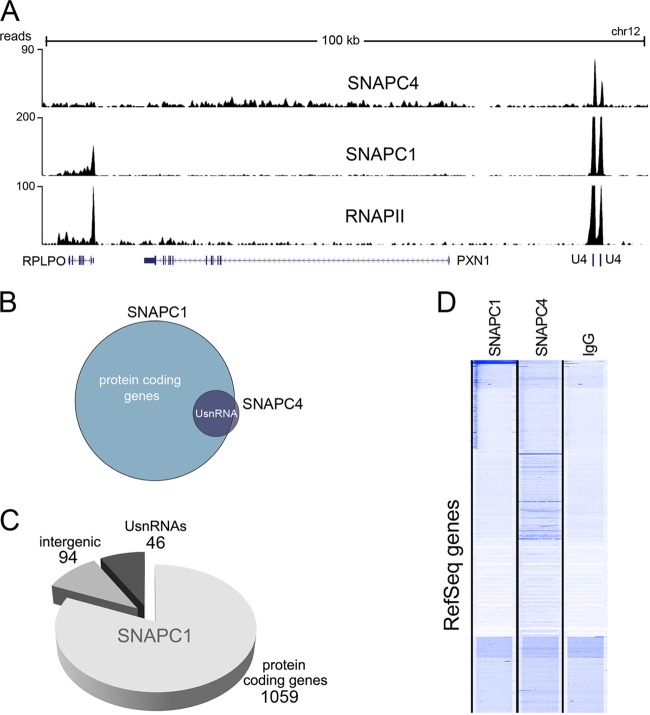
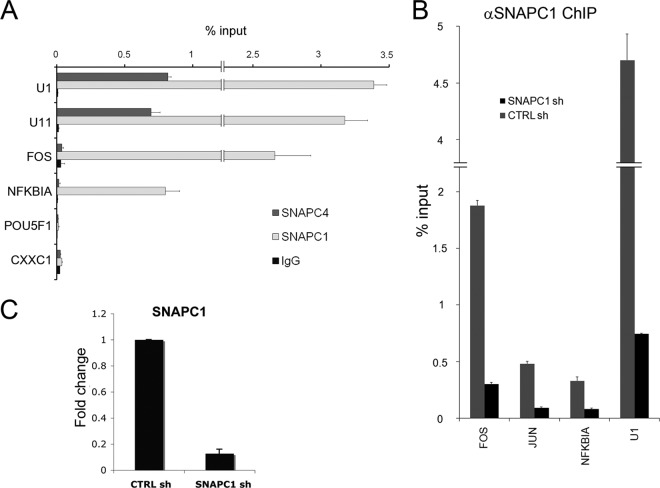
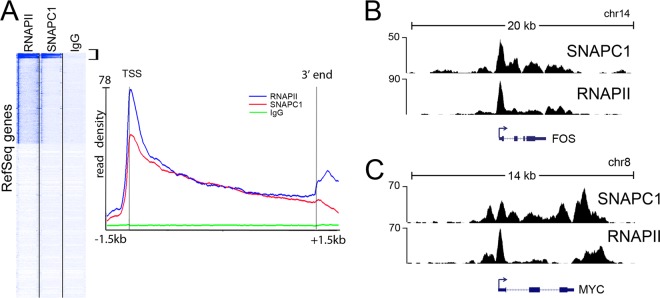
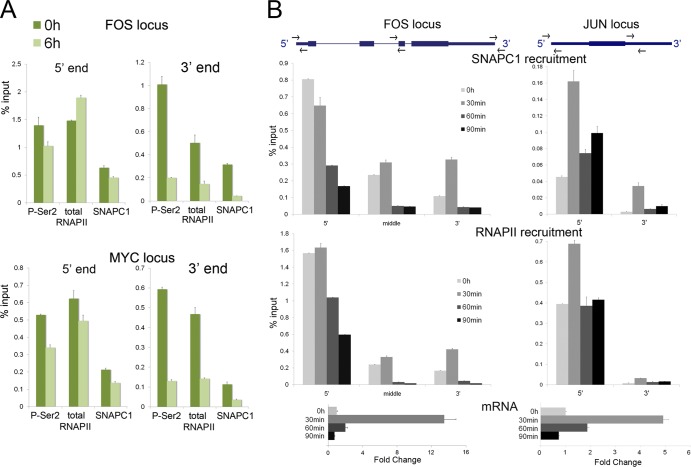
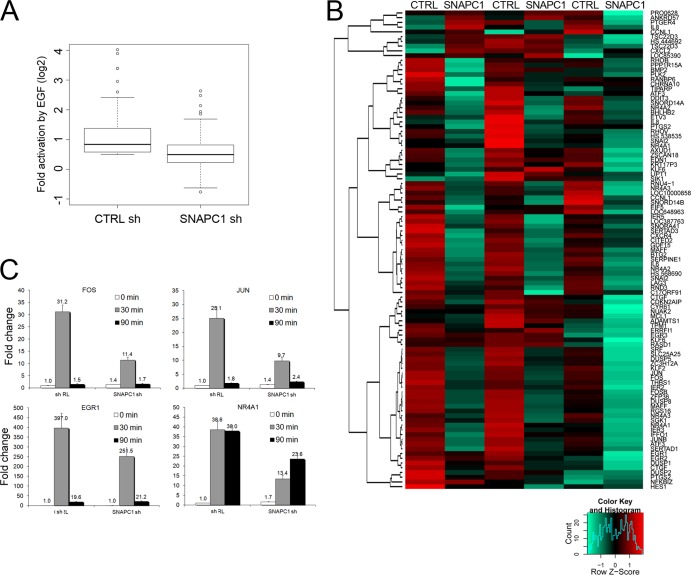
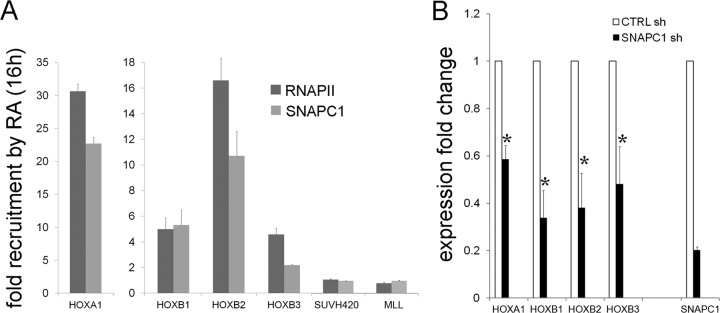
Initiation of transcription of RNA polymerase II (RNAPII)-dependent genes requires the participation of a host of basal transcription factors. Among genes requiring RNAPII for transcription, small nuclear RNAs (snRNAs) display a further requirement for a factor known as snRNA-activating protein complex (SNAPc). The scope of the biological function of SNAPc and its requirement for transcription of protein-coding genes has not been elucidated. To determine the genome-wide occupancy of SNAPc, we performed chromatin immunoprecipitation followed by high-throughput sequencing using antibodies against SNAPC4 and SNAPC1 subunits. Interestingly, while SNAPC4 occupancy was limited to snRNA genes, SNAPC1 chromatin residence extended beyond snRNA genes to include a large number of transcriptionally active protein-coding genes. Notably, SNAPC1 occupancy on highly active genes mirrored that of elongating RNAPII extending through the bodies and 3' ends of protein-coding genes. Inhibition of transcriptional elongation resulted in the loss of SNAPC1 from the 3' ends of genes, reflecting a functional association between SNAPC1 and elongating RNAPII. Importantly, while depletion of SNAPC1 had a small effect on basal transcription, it diminished the transcriptional responsiveness of a large number of genes to two distinct extracellular stimuli, epidermal growth factor (EGF) and retinoic acid (RA). These results highlight a role for SNAPC1 as a general transcriptional coactivator that functions through elongating RNAPII.


Figures

Fig 1
Fig 1
Genome-wide analyses of SNAPC1 and SNAPC4 identify active UsnRNA genes in MCF10A cells. (A) Occupancy of SNAPC1 and SNAPC4 at a tandem of U4 snRNA genes in MCF10A cells. These loci are actively transcribed as suggested by concomitant binding of RNAPII. ChIP-seq tracks are aligned to release hg18 of the UCSC genome browser; values on the y axis indicate the actual number of reads. (B) Unbiased clustering of SNAPC1, SNAPC4, and RNAPII with respect to all human predicted UsnRNAs (1,721 predicted loci, hg18 annotation tables) reveals a set of 29 RNAs where both SNAPC1 and SNAPC4 colocalize. These appear to be the only fraction of UsnRNAs that are actively transcribed in MCF10A cells, according to RNAPII occupancy. (C) Average profiles of SNAPC1, SNAPC4, and RNAPII at active UsnRNAs. Normalized average read density is shown for the group of 29 UsnRNA genes described for panel B. The x axis depicts an average UsnRNA gene (100 to 200 bp) and the surrounding 2 kb. (D) Probability matrices for the PSE and DSE motifs as identified from the 29 UsnRNA promoters occupied by SNAPC1, SNAPC4, and RNAPII. The distribution of PSE and DSE motifs along the promoter is also shown; the PSE clusters around 50 bp upstream from the UsnRNA TSS, while the DSE is distributed mostly from bp −200 to −250.
Fig 2
Fig 2
SNAPC1 genome-wide occupancy extends beyond UsnRNA genes. (A) SNAPC1, SNAPC4, and RNAPII binding at a 100-kb region on chr12 encompassing the U4 loci displayed in Fig. 1A. ChIP-seq reads of SNAPC1 also occupy the TSS and gene body of the ribosomal gene RPLP0, an actively transcribed gene that is also displaying widespread RNAPII binding. (B) SNAPC1 targets an additional set of protein-coding genes. Peak calling analysis of SNAPC4 reveals a very small number of bona fide, high-stringency, peaks (n = 43), compared to a much larger set of SNAPC1 peaks (n = 1,176). SNAPC4 peaks intersect (31/43) the subgroup of SNAPC1 peaks at UsnRNAs, while additional SNAPC1 peaks are found at protein-coding genes. (C) Annotation plot of SNAPC1 binding regions. SNAPC1 peaks are annotated based on RefSeq and RNA Gene tables from the hg18 assembly of the human genome. “Intergenic” refers to binding regions without any GenBank ID or small RNA annotation within a 1-kb radius. Other minor groups of noncoding RNAs are omitted from the pie chart (see Table S3 in the supplemental material). (D) Unbiased clustering of SNAPC1, SNAPC4, and IgG suggests occupancy of a subset of RefSeq genes by SNAPC1 but not SNAPC4.
Fig 3
Fig 3
SNAPC1 occupies a large number of highly active RNAPII genes. (A) SNAPC1 targets protein-coding genes. ChIP analysis of UsnRNA and coding gene loci shows comparable amounts of SNAPC1 but not SNAPC4, which is enriched only at UsnRNAs. POU5F1 and CXXC1 are negative-control loci: POU5F1 (OCT4) is not expressed in MCF10A, while CXXC1 is expressed but not a target of SNAPC1 according to ChIP-seq data. qChIP was performed in MCF10A cells. (B) Anti-SNAPC1 antibody specifically recognizes SNAPC1 at both UsnRNAs and coding genes. HeLa cells were transfected with a specific SNAPC1 or a nontarget shRNA vector (CTRL sh), and cells were selected with puromycin and harvested 96 h after transfection. The SNAPC1 ChIP signal dramatically decreases after shRNA-mediated depletion, at both UsnRNAs and coding genes. (C) Verification of knockdown efficiency for SNAPC1. HeLa cells were transfected with the corresponding shRNA vectors for the different genes and selected with puromycin for 72 h. Total RNA was extracted, reverse transcribed, and analyzed by qPCR. GUSB was used as a reference gene.
Fig 4
Fig 4
SNAPC1 parallels RNAPII occupancy at protein-coding genes. (A) Average profile of occupancy of SNAPC1. Unbiased clustering of SNAPC1 and RNAPII with respect to Refseq genes (23,316 unique genes) identifies a class of 267 genes with the highest number of reads in both ChIP-seq experiments (bracketed in the left panel). The average read densities of SNAPC1, RNAPII, and rabbit IgG at these genes are shown in the right panel. Profiles extend from 1.5 kb before the transcription start site up to 1.5 kb beyond the 3′ ends of the genes. (B) Binding profile of SNAPC1 and RNAPII at the FOS locus. A snapshot from UCSC Genome Browser on chr14 displays SNAPC1 and RNAPII peaking at the TSS of the gene, with additional occupancy into the gene body and the 3′ end. (C) Binding profile of SNAPC1 and RNAPII at the MYC locus on chr8.
Fig 5
Fig 5
SNAPC1 functionally associates with elongating RNAPII. (A) SNAPC1 binding dramatically decreases upon inhibition of elongating RNAPII. qChIP analyses were performed before and after flavopiridol treatment in HeLa cells, revealing major changes at the 3′ ends of FOS and MYC gene loci and a moderate effect at the TSS (5′ end). ChIP values are represented as the average percentage of input from three IPs. (B) SNAPC1 is recruited at the FOS locus during EGF-induced transcriptional activation. qChIP analysis was performed before EGF treatment and 30, 60, and 90 min after induction. The TSS, middle, and 3′ end of FOS were analyzed. ChIP assays were performed in triplicate for each antibody, and average values are shown.
Fig 6
Fig 6
SNAPC1 regulates the responsiveness to EGF-mediated transcriptional activation. (A) SNAPC1 knockdown globally reduces EGF activation of immediate-early response genes. The box plot represents fold activation (expressed as log2) of the 100 most responsive microarray probes after 30 min of induction of HeLa cells with 100 ng/ml EGF. (B) Depletion of SNAPC1 impairs EGF-activated transcription. The heat map representation covers the top 100 microarray probes upregulated by EGF under normal conditions (CTRL shRNA, t = 30 min over t = 0). The color scale represents the modified log2 ratio (“sweep” function R, scaled by row) between the induced and the basal states. The color variation accounts for the difference of induction across the 2 conditions (red, augmented induction; green, decreased induction). Results from three independent experiments are shown. (C) Detailed expression analysis of the effect of SNAPC1 knockdown on the induction by EGF of four immediate-early genes. Cells were harvested at 0, 30, and 90 min after induction. GUSB was used as a control gene. The control shRNA at time zero was used as a reference. Data are the averages from three independent experiments.
Fig 7
Fig 7
SNAPC1 regulates the responsiveness to retinoic acid in NT2/D1 cells. (A) SNAPC1 and RNAPII are recruited to the transcriptional start site of HOX genes. ChIP analysis was performed on human teratocarcinoma-derived NT2/D1 cells upon 16 h of induction with retinoic acid (ATRA). Quantitative ChIP data were obtained for the TSS of HOXA1, HOXB1, HOXB2, and HOXB3. Data are plotted as relative enrichment compared to the noninduced state. (B) SNAPC1 depletion impairs transcriptional activation at HOXA and HOXB clusters. NT2/D1 cells were interfered for SNAPC1 and stimulated with 10 μM ATRA. RNA was collected at t = 16 h, and the relative induction over the control shRNA (CTRL sh) was calculated. Data were normalized to GUSB expression. Results from three independent experiments are plotted (*, P < 0.05).

Similar articles

Cited by

References

    1. Amit I, et al. 2007. A module of negative feedback regulators defines growth factor signaling. Nat. Genet. 39:503–512 - PubMed
    1. Bai L, Wang Z, Yoon JB, Roeder RG. 1996. Cloning and characterization of the beta subunit of human proximal sequence element-binding transcription factor and its involvement in transcription of small nuclear RNA genes by RNA polymerases II and III. Mol. Cell. Biol. 16:5419–5426 - PMC - PubMed
    1. Bailey TL, et al. 2009. MEME SUITE: tools for motif discovery and searching. Nucleic Acids Res. 37:W202–W208 - PMC - PubMed
    1. Canella D, Praz V, Reina JH, Cousin P, Hernandez N. 2010. Defining the RNA polymerase III transcriptome: genome-wide localization of the RNA polymerase III transcription machinery in human cells. Genome Res. 20:710–721 - PMC - PubMed
    1. Cesaroni M, Cittaro D, Brozzi A, Pelicci PG, Luzi L. 2008. CARPET: a web-based package for the analysis of ChIP-chip and expression tiling data. Bioinformatics 24:2918–2920 - PubMed

Publication types

MeSH terms