. 2012:2012:818456.
doi: 10.1155/2012/818456. Epub 2012 Feb 22.

Arterial Spin Labeling (ASL) fMRI: advantages, theoretical constrains, and experimental challenges in neurosciences

Affiliations

Arterial Spin Labeling (ASL) fMRI: advantages, theoretical constrains, and experimental challenges in neurosciences

Ajna Borogovac et al. Int J Biomed Imaging. 2012.

Erratum in

  • Int J Biomed Imaging. 2012;2012:658101

Abstract

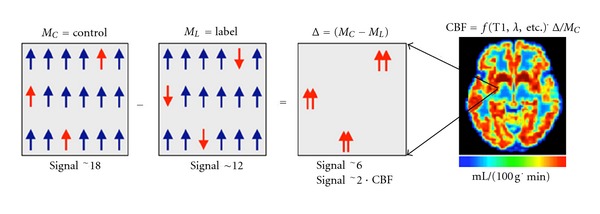
Cerebral blood flow (CBF) is a well-established correlate of brain function and therefore an essential parameter for studying the brain at both normal and diseased states. Arterial spin labeling (ASL) is a noninvasive fMRI technique that uses arterial water as an endogenous tracer to measure CBF. ASL provides reliable absolute quantification of CBF with higher spatial and temporal resolution than other techniques. And yet, the routine application of ASL has been somewhat limited. In this review, we start by highlighting theoretical complexities and technical challenges of ASL fMRI for basic and clinical research. While underscoring the main advantages of ASL versus other techniques such as BOLD, we also expound on inherent challenges and confounds in ASL perfusion imaging. In closing, we expound on several exciting developments in the field that we believe will make ASL reach its full potential in neuroscience research.


Figures

Figure 1
Figure 1
Schematic presentation of how ASL signal is obtained. The first three panels represent the signal from a single imaged voxel that originates from the control (left), label (center), and control-label difference (right) panels, respectively. The numbers are not meant to represent real flow. A real CBF image is shown in the rightmost panel. The color bar represents flow in [0–107] mL/100 g·min range. Note that, as mentioned in text, the difference ∆ = (M CM L) image is converted to a single CBF image via a function that includes physiological and MR parameters such as relaxation rates, transit times, and blood tissue water partition coefficient, λ.
Figure 2
Figure 2
(a) Three-vessel encoding of vasculature above the Circle of Willis. In the labeling plane shown on the right, the ACA is well confined to the midline with the corresponding flow territory represented in pCASL perfusion maps as green. The territories supplied by the insular branches of the MCAs are also well labeled (shown in red and blue). Figure taken without modification from Wong [25]. (b) Selective encoding of three branches of the ACA using super-selective pCASL [26]. Top row shows TOF image and the corresponding saggital maximum intensity projection with the branches of the ACA color coded. The bottom row shows perfusion-weighted images of the territories fed by each vessel. Figure was taken without modification from Helle et al. [26].
Figure 3
Figure 3
CBF images from three simulation data sets: (a) homogenous gray matter CBF, (b) superimposed spatially sinusoidal fluctuation, and (c) localized regions of hypo- and hyperperfusion. CBF images from conventional CASL (3rd column) are compared with those from PVE correction performed in the time domain [41] (4th column) [40], and PVE correction done spatially with a small and a large kernel size (columns 5th and 6th, resp.). Note that the time-domain PVE (4th column) retains the spatial features of the true hypo/hyperperfused regions (2nd column) whereas the spatially applied PVE method has a smoothing effect that increases with the size of the kernel. Figure was taken without modification from Chappell et al. [53].
Figure 4
Figure 4
Voxelwise estimation of ATT values using a multiple-labeling-duration acquisition described in Borogovac et al. [55]. The units in the color bars are in seconds. Note regional heterogeneity in group mean ATT shown in the 2nd row. Also, across subjects standard deviation maps (3rd row) indicate variability in ATT especially in the posterior regions. This variability is expected to be higher in disease. Figure taken with permission from Borogovac et al. [55].
Figure 5
Figure 5
Tracking functional changes over one month. (a) Comparing baseline CBF on day 1 (indicated by first red horizontal line in upper panel, illustrating experimental design), and baseline CBF on day 30 (second red line in upper panel) shows stability over time. Middle panel shows the whole brain maps on day 1, and lower panel shows whole brain maps on day 30. (b) Comparing acute CBF changes induced by visual or motor stimulation on day 30 to baseline CBF on day 1 (as illustrated in the upper panel) is similar to acute changes induced by visual or motor stimulation on day 1 to baseline CBF on day 1. Middle panel shows the whole brain maps of day 1 stimulation to day 1 baseline, and lower panel shows whole brain maps of day 30 stimulation to day 1 baseline. Maps show similar motor and visual cortex activations. (Note that this is a modified version of Figure 3 in Borogovac et al. [55]).

Similar articles

Cited by

References

    1. Buxton R. Introduction to Functional Magnetic Resonance Imaging. Cambridge University Press; 2009.
    1. Alsop DC, Detre JA. Reduced transit-time sensitivity in noninvasive magnetic resonance imaging of human cerebral blood flow. Journal of Cerebral Blood Flow and Metabolism. 1996;16(6):1236–1249. - PubMed
    1. Kim DH, Spielman DM. Reducing gradient imperfections for spiral magnetic resonance spectroscopic imaging. Magnetic Resonance in Medicine. 2006;56(1):198–203. - PubMed
    1. Williams DS, Detre JA, Leigh JS, Koretsky AP. Magnetic resonance imaging of perfusion using spin inversion of arterial water. Proceedings of the National Academy of Sciences of the United States of America. 1992;89(1):212–216. - PMC - PubMed
    1. Golay X, Hendrikse J, Lim TCC. Perfusion imaging using arterial spin labeling. Topics in Magnetic Resonance Imaging. 2004;15(1):10–27. - PubMed

LinkOut - more resources