

T regulatory cell markers in oral squamous cell carcinoma: Relationship with survival and tumor aggressiveness
- PMID: 22966269
- PMCID: PMC3436214
- DOI: 10.3892/ol_00000023
T regulatory cell markers in oral squamous cell carcinoma: Relationship with survival and tumor aggressiveness
Abstract
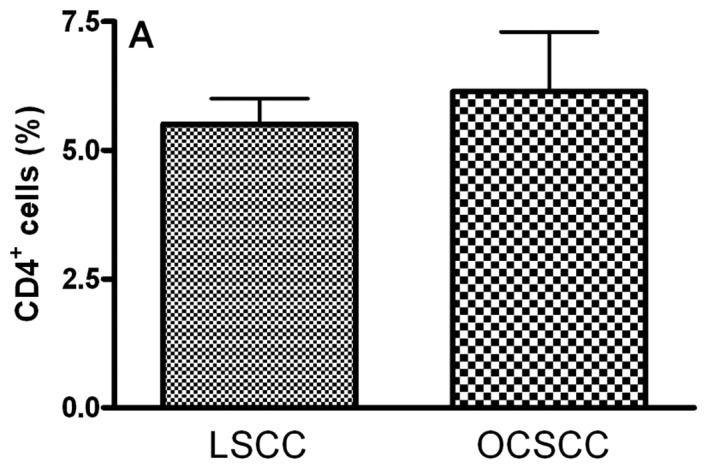
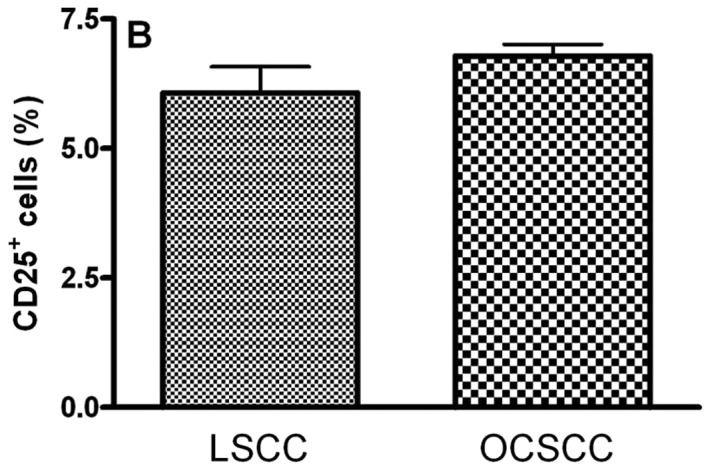
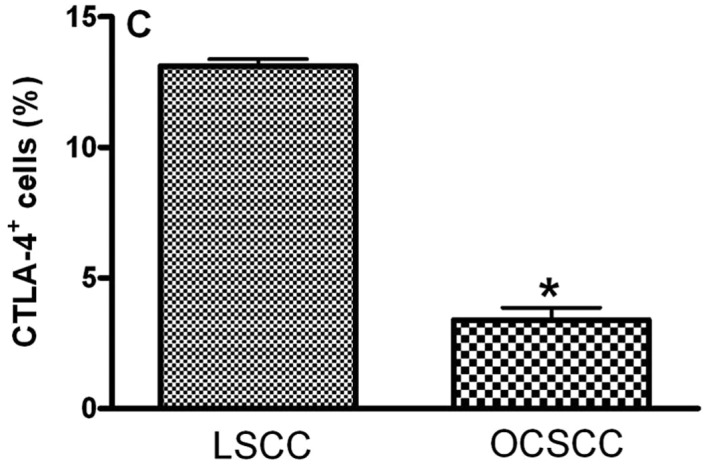
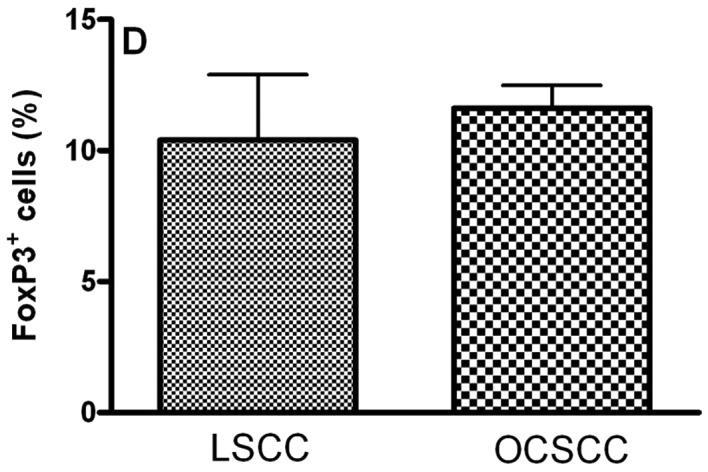
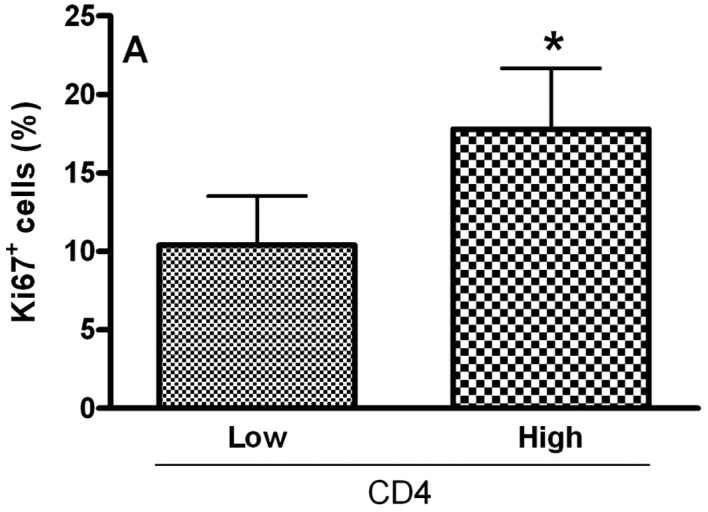
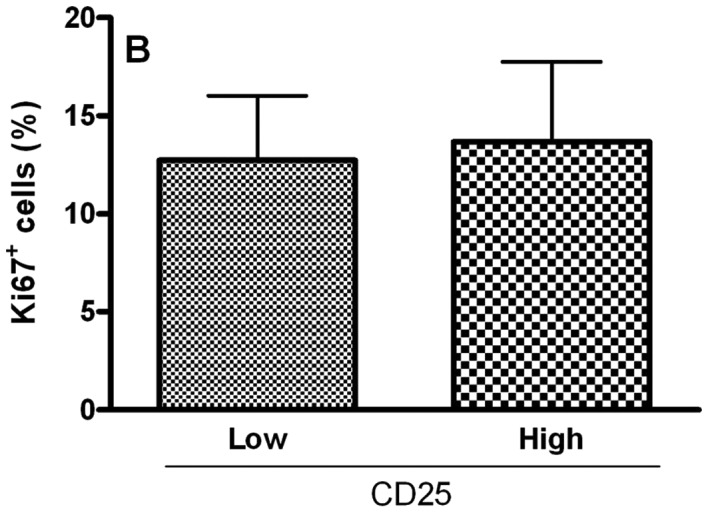
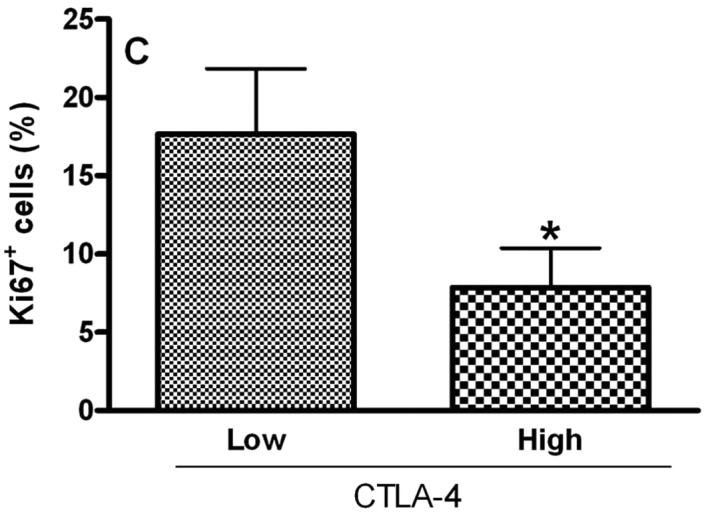
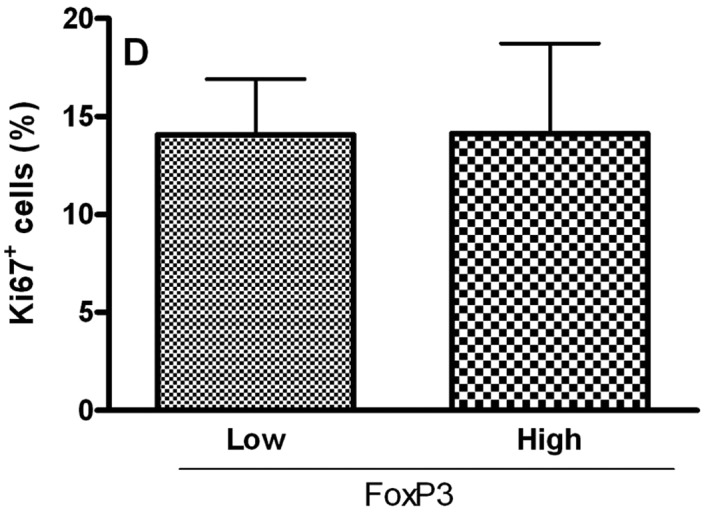
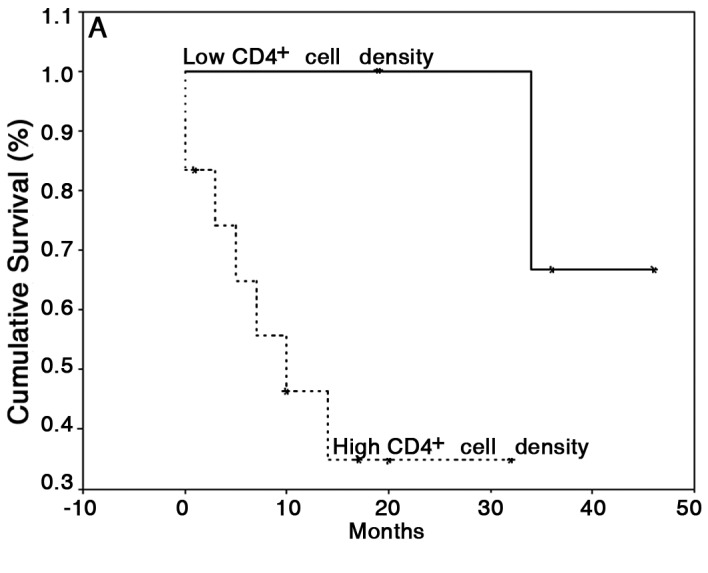
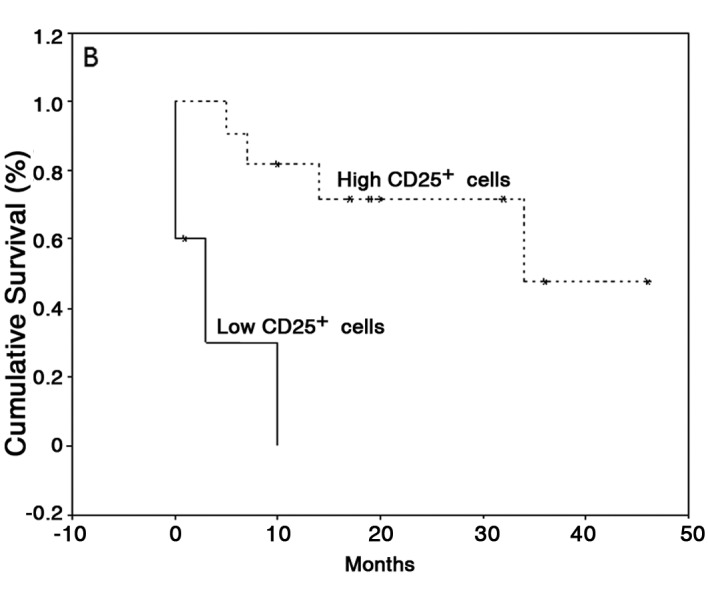
Tumor-infiltrating lymphocytes (TILs) are a heterogeneous cell family which plays an important role in tumor-associated immune response. Of these, T regulatory (Treg) cells have also been shown to inhibit anti-tumor response. We aimed to evaluate the expression of T regulatory cell markers (CD4, CD25, CTLA-4 and FoxP3) in samples of oral cavity squamous cell carcinoma (OCSCC) and lip SCC (LSCC) by immunohistochemistry. The relationship of Treg markers with survival data and the proliferative index were also evaluated. We observed similar numbers of CD4-, CD25- and FoxP3(+) cells in OCSCC and LSCC. On the other hand, numbers of CTLA-4(+) cells were significantly lower in OCSCC than in LSCC. OCSCC samples with high numbers of CD4 exhibited a high proliferative index, while samples with high CTLA-4 counts demonstrated a low tumoral proliferative index. A log-rank test showed that patients with OCSCC that presented high counts of CD4 showed a significantly decreased survival compared with patients with low cell counts. In contrast, high CD25(+) cell counts were associated with increased survival. Our results suggest an association of CD4 with poor prognosis, while CD25 expression is related with favorable prognosis. These findings result from the heterogeneity of TIL subsets that display an antagonistic role in tumor immune cell response.
Figures
Similar articles
-
Composition and plasticity of triple-negative breast carcinoma-infiltrating regulatory T cells.APMIS. 2020 Mar;128(3):260-269. doi: 10.1111/apm.13022. Epub 2020 Jan 28. APMIS. 2020. PMID: 31811667
-
Association of CCL2 with lymph node metastasis and macrophage infiltration in oral cavity and lip squamous cell carcinoma.Tumour Biol. 2008;29(2):114-21. doi: 10.1159/000137669. Epub 2008 Jun 5. Tumour Biol. 2008. PMID: 18525219
-
Tumor-infiltrating cytotoxic T cells but not regulatory T cells predict outcome in anal squamous cell carcinoma.Clin Cancer Res. 2006 Jun 1;12(11 Pt 1):3355-60. doi: 10.1158/1078-0432.CCR-05-2434. Clin Cancer Res. 2006. PMID: 16740757
-
Tumor-infiltrating B cells and T cells correlate with postoperative prognosis in triple-negative carcinoma of the breast.BMC Cancer. 2021 Mar 16;21(1):286. doi: 10.1186/s12885-021-08009-x. BMC Cancer. 2021. PMID: 33726701 Free PMC article.
-
Tumor-Infiltrating Lymphocytes in the Tumor Microenvironment of Laryngeal Squamous Cell Carcinoma: Systematic Review and Meta-Analysis.Biomedicines. 2021 Apr 28;9(5):486. doi: 10.3390/biomedicines9050486. Biomedicines. 2021. PMID: 33925205 Free PMC article. Review.
Cited by
-
Immune Checkpoint Inhibitors in Oral Cavity Squamous Cell Carcinoma and Oral Potentially Malignant Disorders: A Systematic Review.Cancers (Basel). 2020 Jul 17;12(7):1937. doi: 10.3390/cancers12071937. Cancers (Basel). 2020. PMID: 32708945 Free PMC article. Review.
-
Immunomodulatory role of tumor microenvironment on oncological outcomes in advanced laryngeal cancer.BMC Cancer. 2024 Oct 1;24(1):1219. doi: 10.1186/s12885-024-12959-3. BMC Cancer. 2024. PMID: 39354397 Free PMC article.
-
Spatial Distribution and Prognostic Value of T Cell Subtypes and Immune Biomarkers in p16-Negative HNSCC.Cells. 2025 May 27;14(11):789. doi: 10.3390/cells14110789. Cells. 2025. PMID: 40497965 Free PMC article.
-
Prognostic Role of Tumor-Infiltrating Lymphocytes and Tumor Budding in Early Oral Tongue Carcinoma.Laryngoscope. 2021 Nov;131(11):2512-2518. doi: 10.1002/lary.29589. Epub 2021 May 6. Laryngoscope. 2021. PMID: 33955550 Free PMC article.
-
Tumor Microenvironment and Immune Response in Lip Cancer.Cancers (Basel). 2023 Feb 25;15(5):1478. doi: 10.3390/cancers15051478. Cancers (Basel). 2023. PMID: 36900270 Free PMC article.
References
-
- Hanahan D, Lanzavecchia A, Mihich E. Fourteenth Annual Pezcoller Symposium: the novel dichotomy of immune interactions with tumors. Cancer Res. 2003;63:3005–3008. - PubMed
-
- Oliveira-Neto HH, Leite AF, Costa NL, et al. Decrease in mast cells in oral squamous cell carcinoma: possible failure in the migration of these cells. Oral Oncol. 2007;43:484–490. - PubMed
-
- Wang HY, Lee DA, Peng G, et al. Tumor-specific human CD4+ regulatory T cells and their ligands: implications for immunotherapy. Immunity. 2004;20:107–118. - PubMed
LinkOut - more resources
Full Text Sources
Research Materials