. 2012 Sep 11:11:124.
doi: 10.1186/1475-2859-11-124.

Capsid protein expression and adeno-associated virus like particles assembly in Saccharomyces cerevisiae

Affiliations

Capsid protein expression and adeno-associated virus like particles assembly in Saccharomyces cerevisiae

Ana Backovic et al. Microb Cell Fact. .

Abstract

Background: The budding yeast Saccharomyces cerevisiae supports replication of many different RNA or DNA viruses (e.g. Tombusviruses or Papillomaviruses) and has provided means for up-scalable, cost- and time-effective production of various virus-like particles (e.g. Human Parvovirus B19 or Rotavirus). We have recently demonstrated that S. cerevisiae can form single stranded DNA AAV2 genomes starting from a circular plasmid. In this work, we have investigated the possibility to assemble AAV capsids in yeast.

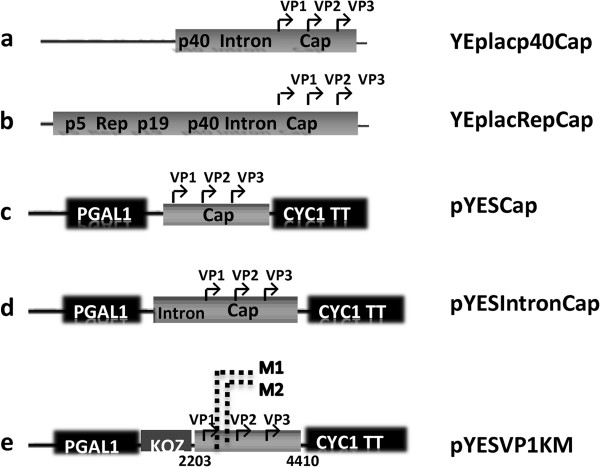
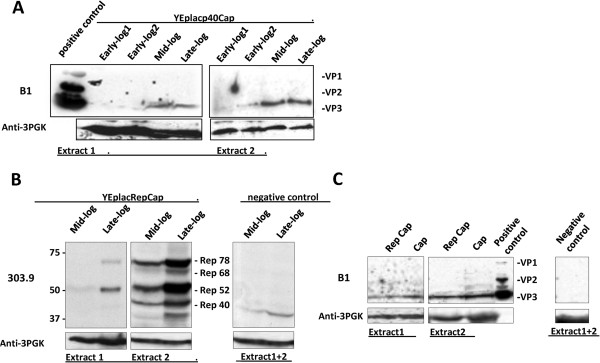
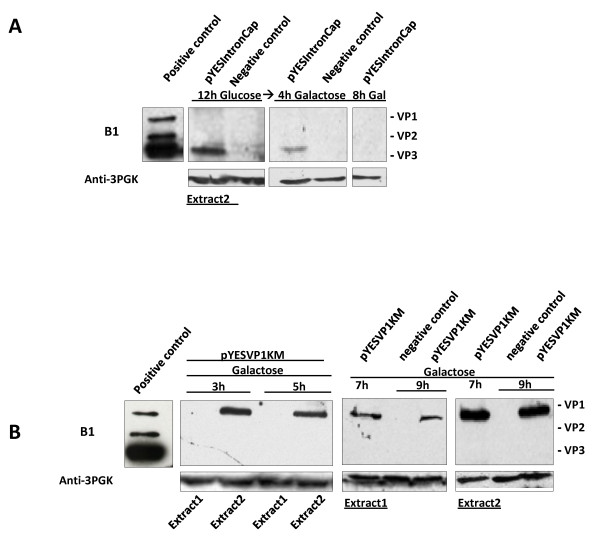
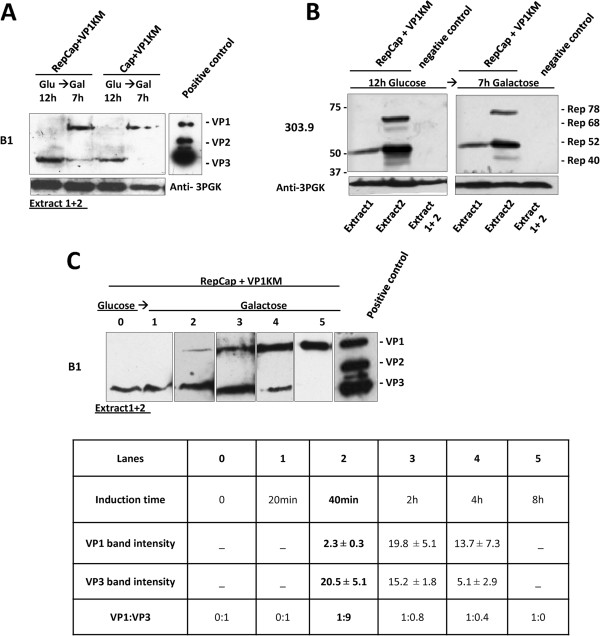
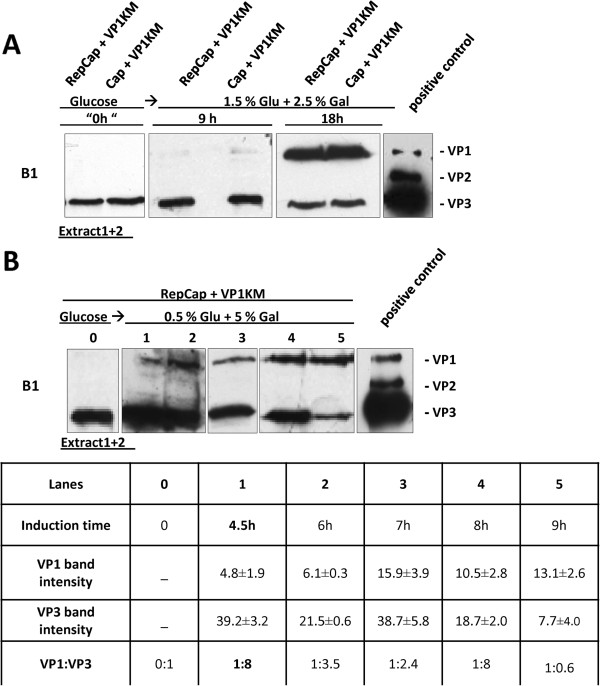
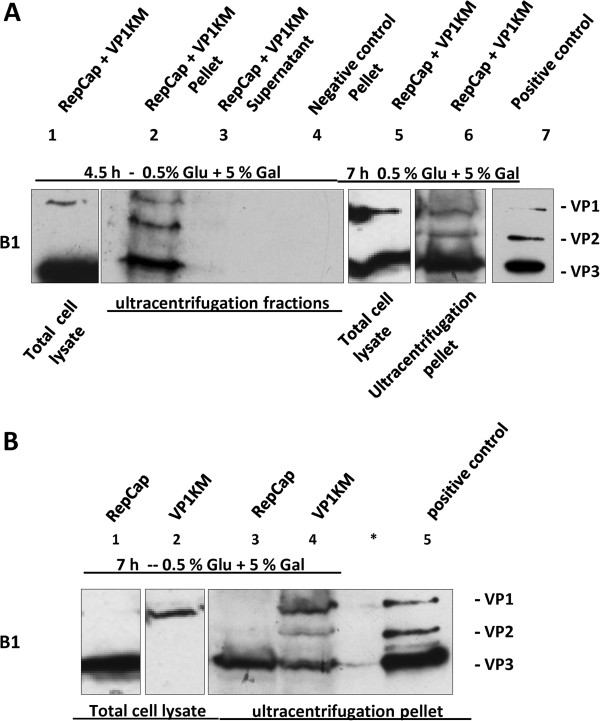
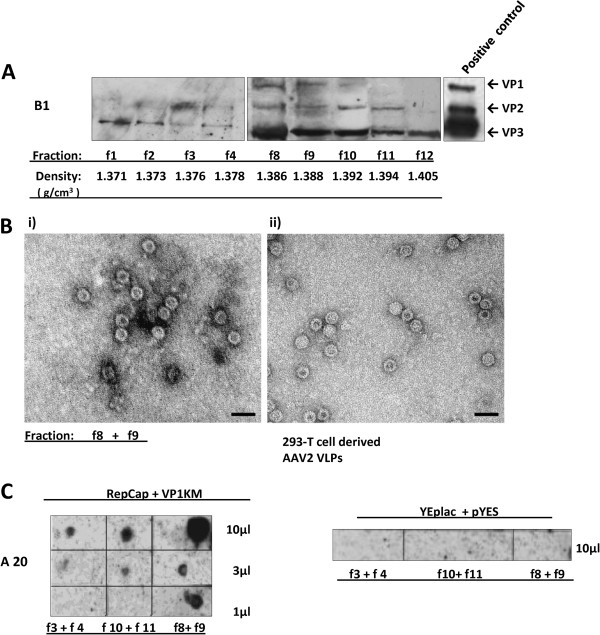
Results: To do this, at least two out of three AAV structural proteins, VP1 and VP3, have to be simultaneously expressed in yeast cells and their intracellular stoichiometry has to resemble the one found in the particles derived from mammalian or insect cells. This was achieved by stable co-transformation of yeast cells with two plasmids, one expressing VP3 from its natural p40 promoter and the other one primarily expressing VP1 from a modified AAV2 Cap gene under the control of the inducible yeast promoter Gal1. Among various induction strategies we tested, the best one to yield the appropriate VP1:VP3 ratio was 4.5 hour induction in the medium containing 0.5% glucose and 5% galactose. Following such induction, AAV virus like particles (VLPs) were isolated from yeast by two step ultracentrifugation procedure. The transmission electron microscopy analysis revealed that their morphology is similar to the empty capsids produced in human cells.

Conclusions: Taken together, the results show for the first time that yeast can be used to assemble AAV capsid and, therefore, as a genetic system to identify novel cellular factors involved in AAV biology.


Figures

Figure 1
Figure 1
Schematic representation of expression cassettes constructed in this study.a) In the plasmid YEplacp40Cap, entire AAV2 cap gene is under control of AAV2 p40 promoter. b) the YEplacRepCap plasmid contains rep and cap gene in wt configuration. c) In the vector pYESCap, the entire cap gene is under control of Gal1 promoter. d) In the plasmid pYESIntronCap, the cap gene is placed under control of Gal1 promoter and the AAV2 intron sequence upstream the promoter. e) In the vector pYESVP1KM, the VP1 coding sequence, placed under control of Gal1 promoter, was mutated in three sites. The point mutations were made in position 11 to eliminate an out of frame ATG codon (indicated as M1 in the scheme), in position 21 and 24 to inactivate the major AAV splice acceptor site (indicated as M2 in the schemes). A yeast Kozak like sequence was cloned upstream the VP1 start codon.
Figure 2
Figure 2
Expression of AAV2 Cap and Rep proteins from natural promoters. Transformed RSY12 cells were grown in liquid selective medium until cultures reached different densities determining different growth phases (early → late log) indicated on the top. Equal amounts of total cell lysate, extract 1 and 2 (~50 μg each), obtained from 2 × 10⁸ cells at each phase, were analyzed by Western blot analysis with antibodies indicated on the left: mAb B1 to detect Cap proteins (A and C), mAb 303.9 to detect Rep proteins (B) and mAb Anti-3PGK to detect constitutive yeast protein PGK (Phospho-Glicerate-Kinase). (A): VP3 was the only capsid protein detected in the samples from YEplacp40Cap transformed cells;thehighest level was detected in the mid-log phase extracts. (B): All four Rep proteins were detected in the samples from YEplacRepCap transformed cells; the highest level was obtained in the late-log phase extracts. (C): late-log phase extracts from YEplacRepCap cells were also analyzed for Cap protein expression and compared with late-log phase extracts from YEplacp40Cap cells; only VP3 was detected in both samples. Denatured, 293 T-cell-derived, AAV2 capsids were used as positive control (+ control) for defining VPs (A, C).
Figure 3
Figure 3
Expression of AAV2 structural proteins from yeast the galactose-inducible promoter Gal1. (A): pYESIntronCap-transformed cells were first grown for 12 h in glucose and then transferred to galactose medium for 4 and 8 h of induction. Mid-log phase cells were collected at each of these time points and equal amounts of the total cell lysates (~50 μg), were analyzed for Cap protein expression by Western blot using mAb B1. VP3 was the only Cap protein detected and only in the extract 2 (insoluble fraction). Its relative amount was the highest in 12 h glucose samples, diminished after 4 h induction and was no more detectable upon 8 h of galactose induction. (B): pYESVP1KM-transformed yeast cells were exposed to galactose for different times, as indicated on the top, and equal amount of corresponding protein (~50 μg) extracts was analyzed for Cap protein expression using mAb B1. The majority of VP1 proteins were found in extract 2 (insoluble fraction). Extracts from cells transformed with empty vector, pYES2 were used as negative controls (−control).
Figure 4
Figure 4
VP1-VP3 expression pattern in co-transformed yeast clones. Cells co-transformed with YEplacp40Cap and pYESVP1KM (Cap + VP1KM clone) (A) and Rep expressing cells co-transformed with YEplacRepCap and pYESVP1KM (RepCap + VP1KM) (B), were grown on glucose and then transferred to galactose for induction. Equal amounts of total cellular proteins (extracts 1 + 2) were analyzed by Western blot, using mAb B1 to detect VP proteins. (A): VP3 was detected in both yeast clones after 12 h growth in glucose and it decreased along with VP1 induction upon 7 h in galactose. (B): Extracts from RepCap + VP1KM clones were analyzed for Rep protein expression before (12 h glucose) and after 7 h galactose growth, using mAb 303.9. Similar amounts and distribution of Rep isoforms to extracts 1/2 were detected in glucose and galactose samples. Extracts from cells co-transformed with empty vectors, YEplac181 and pYES2 were used as -control. (C): Lanes 0–5: VP1-VP3 expression pattern in total cell-extracts derived from RepCap + VP1KM clones before induction (“0” time point) and at various times of galactose induction. VP1:VP3 ratios are determined band densitometry and shown in the table below. Numbers represent the density expressed in arbitrary unit detected by the analysis software described in materials and methods. Results are reported as mean of at least three independent experiments ± standard error. The best ratio was obtained after 40 minutes of galactose induction.
Figure 5
Figure 5
VP1:VP3 optimization with “low glucose-high galactose” induction strategy. (A) After over-night growth on glucose, YEplacRepCap + pYESVP1KM (RepCap + VP1KM) and YEplacp40Cap + pYESVP1KM (Cap + VP1KM) yeast clones were induced in the presence of high glucose (1.5%) and high galactose (2.5%) concentration. VP expression was analyzed by Western blot at three different time points before induction (“0 h”) and after 9 h and 18 h. There was no significant difference in VP1/VP3 expression pattern between clones and the best ratio (1:9), was detected for 9 h induction time for yeast cells co-transformed with YEplacRepCap and pYESVP1KM (RepCap + VP1KM) . (B) After overnight growth on glucose, YEplacRepCap and pYESVP1KM (RepCap + VP1KM) co-transformed yeast cells were induced in the medium containing low glucose (0.5%) and high galactose (5%) concentration. Lanes 0–5: VP1-VP3 expression pattern was determined by Western blot analysis before induction (lane1,“0 h”) and after 5 different induction periods (lane 2, 4.5 h; lane 3, 6 h; lane 4, 7 h; lane 5, 8 h, lane 6, 9 h) . VP1:VP3 ratios, calculated by means of band densitometry, are presented in the table below. Numbers represent the density expressed in arbitrary unit detected by the analysis software described in materials and methods. Results are reported as mean of at least three independent experiment ± standard error. The best ratio was obtained after 4.5 h induction in 0.5% glucose + 5% galactose medium (lane 2).
Figure 6
Figure 6
Concentration of AAV2 capsid like-structures by high-speed ultracentrifugation through 40% sucrose-cushion. (A): YEplacRepCap + pYESVP1KM (RepCap + VP1KM)co-transformed yeast cells induced for 4.5 h (lanes 1–4) or 7 h (lanes 5 and 6) in 0.5% Glu + 5% Gal medium were subjected to a small scale (2 x 10⁸ cells) - protein extraction yielding total cell lysate (lanes 1 and 5) and to a large scale extraction (~400 x 108 cells) (lanes 2, 3, 4 and 6) under non-denaturing conditions yielding the “native extract“ which was subjected to ultracentrifugation. As indicated on the bottom, the total cell lysate (lanes 1 and 5) and the resulting ultracentrifugation fractions, the supernatant (lane 3) and the pellet (lanes 2 and 6), were analyzed for the presence of VP proteins by Western blot. The antibody mAb B1 recognized only VP1 ad VP3 in the total cell lysate and all three VPs in the pellet fraction. The VP ratios in the total cell lysate were 1:8 (lane 1) and 1:3.3 (lane 5). The VP ratios in the pellet resulting from ultracentrifugation were 1:1.2:6.5 (lane 2), 1:3 (lane 6). The pellet obtained by ultracentrifugation of the extracts derived from cells co-transformed with empty vectors, YEplac181 and pYES2, was used as negative control (lane 4). Positive control is loaded in lane 7. (B): Cells transformed with YEplacRepCap (RepCap, lane 1 and 3) or with pYESVP1KM (VP1KM, lane 2 and 4) were induced for 7 h in 0.5% glucose + 5% galactose medium. All cells were processed as described in (A). VP proteins in the total cell lysates (lanes 1 and 2) and the ultracentrifugation pellet (lanes 3 and 4) were identified by Western blot analysis with mAb B1. The relative VP ratio is 1:0.25:0.9 for sample loaded in lane 4. No proteins were loaded in lanes marked with *. In the lane 5 the positive control was loaded.
Figure 7
Figure 7
Isolation of AAV2 capsid like-structures by ultracentrifugation in CsCl-gradient. Native protein extracts derived from ~ 0.5x10¹² YEplacRepCap + pYESVP1KM (RepCap + VP1KM)co-transformed yeast cells, induced under optimal conditions, were subjected to 40% sucrose cushion-ultracentrifugation and the pelleted material was further fractionated in CsCl gradient by 48 h,. (A): 12 CsCl fractions of increasing densities were recovered and analyzed for the presence of VP proteins by Western blot with mAb B1. Only VP positive fractions are presented. Structures recovered in fractions 8–11 had VP compositions that most closely resembled the one of wt capsids. Denatured 293 T-cell derived AAV2 capsids were used as positive control for defining VPs. (B): Fractions of similar densities were united and subjected to TEM analysis. (i) Capsid-like structures of ~20 nm size identified in fraction f8 + f9 are shown and compared with 293 T –derived AAV2 empty capsids (ii). Scale bar is 40 nm. (C): 3 fraction pairs that gave positive results in TEM were spotted on the nitrocellulose membrane in three quantities indicated on the right side bar and analyzed for the presence of AAV capsids with the capsid-specific mAb A20 antibody. The strongest signal (which indicates the greatest number of capsids) was detected in the fraction f8 + f9. As negative control of the assay, the same number of cells co-transformed with empty vectors, YEplac181 and pYES2, were processed as described in (A) and the obtained CsCl fractions of the corresponding densities were incubated with A20 antibody. The name of fractions and relative density are indicated.

References

    1. Lukashov VV, Goudsmit J. Evolutionary relationships among parvoviruses: virus-host coevolution among autonomous primate parvoviruses and links between adeno-associated and avian parvoviruses. J Virol. 2001;75(6):2729–2740. doi: 10.1128/JVI.75.6.2729-2740.2001. - DOI - PMC - PubMed
    1. Buning H, Perabo L, Coutelle O, Quadt-Humme S, Hallek M. Recent developments in adeno-associated virus vector technology. J Gene Med. 2008;10(7):717–733. doi: 10.1002/jgm.1205. - DOI - PubMed
    1. Van Vliet KM, Blouin V, Brument N, Agbandje-McKenna M, Snyder RO. The role of the adeno-associated virus capsid in gene transfer. Methods Mol Biol. 2008;437:51–91. doi: 10.1007/978-1-59745-210-6_2. - DOI - PMC - PubMed
    1. Becerra SP, Koczot F, Fabisch P, Rose JA. Synthesis of adeno-associated virus structural proteins requires both alternative mRNA splicing and alternative initiations from a single transcript. J Virol. 1988;62(8):2745–2754. - PMC - PubMed
    1. Sonntag F, Schmidt K, Kleinschmidt JA. A viral assembly factor promotes AAV2 capsid formation in the nucleolus. Proc Natl Acad Sci U S A. 2010;107(22):10220–10225. doi: 10.1073/pnas.1001673107. - DOI - PMC - PubMed

Publication types

MeSH terms