

Bmi-1 promotes the aggressiveness of glioma via activating the NF-kappaB/MMP-9 signaling pathway
- PMID: 22967049
- PMCID: PMC3502583
- DOI: 10.1186/1471-2407-12-406
Bmi-1 promotes the aggressiveness of glioma via activating the NF-kappaB/MMP-9 signaling pathway
Abstract
Background: The prognosis of human glioma is poor, and the highly invasive nature of the disease represents a major impediment to current therapeutic modalities. The oncoprotein B-cell-specific Moloney murine leukemia virus integration site 1 protein (Bmi-1) has been linked to the development and progression of glioma; however, the biological role of Bmi-1 in the invasion of glioma remains unclear.
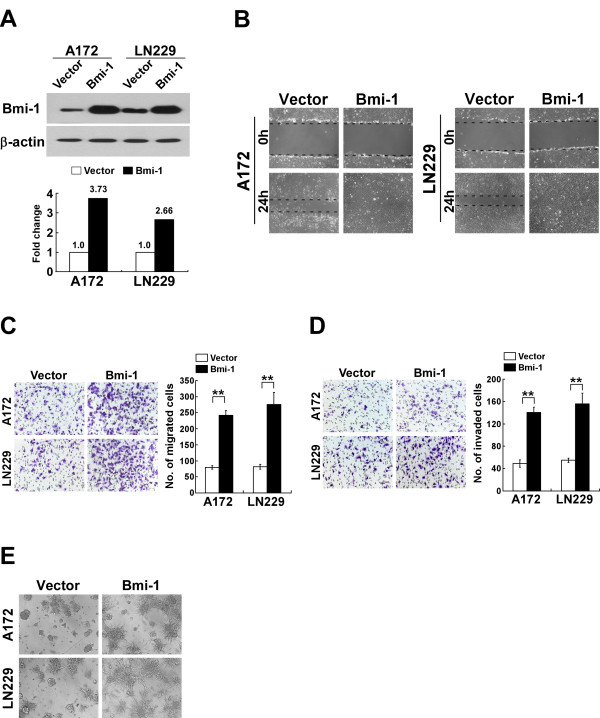
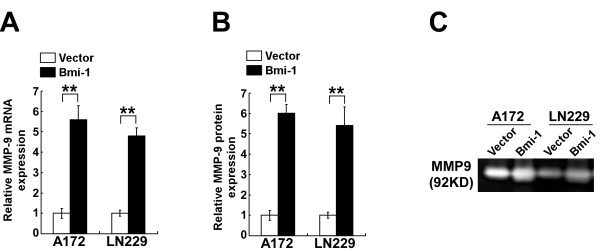
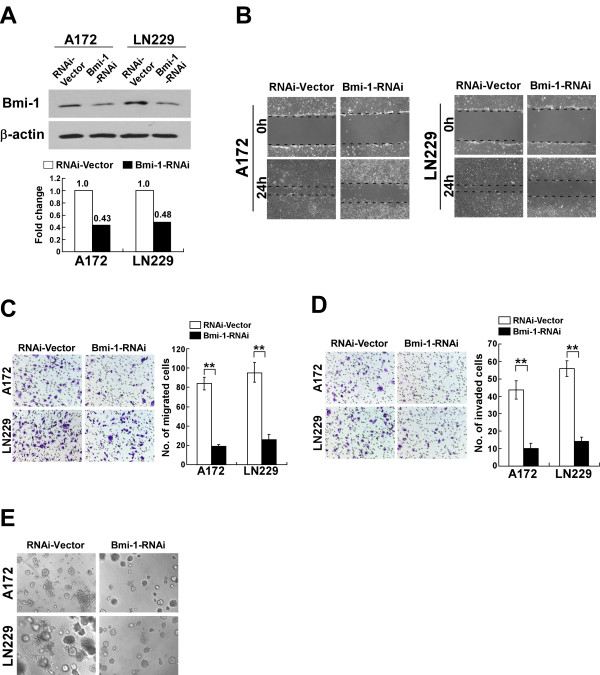
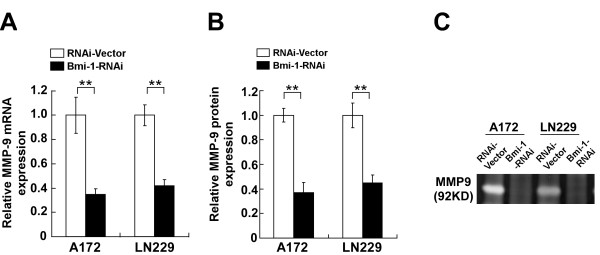
Methods: A172 and LN229 glioma cells were engineered to overexpress Bmi-1 via stable transfection or to be silenced for Bmi-1 expression using RNA interfering method. Migration and invasiveness of the engineered cells were assessed using wound healing assay, Transwell migration assay, Transwell matrix penetration assay and 3-D spheroid invasion assay. MMP-9 expression and activity were measured using real-time PCR, ELISA and the gelatin zymography methods. Expression of NF-kappaB target genes was quantified using real-time PCR. NF-kappaB transcriptional activity was assessed using an NF-kappaB luciferase reporter system. Expression of Bmi-1 and MMP-9 in clinical specimens was analyzed using immunohistochemical assay.
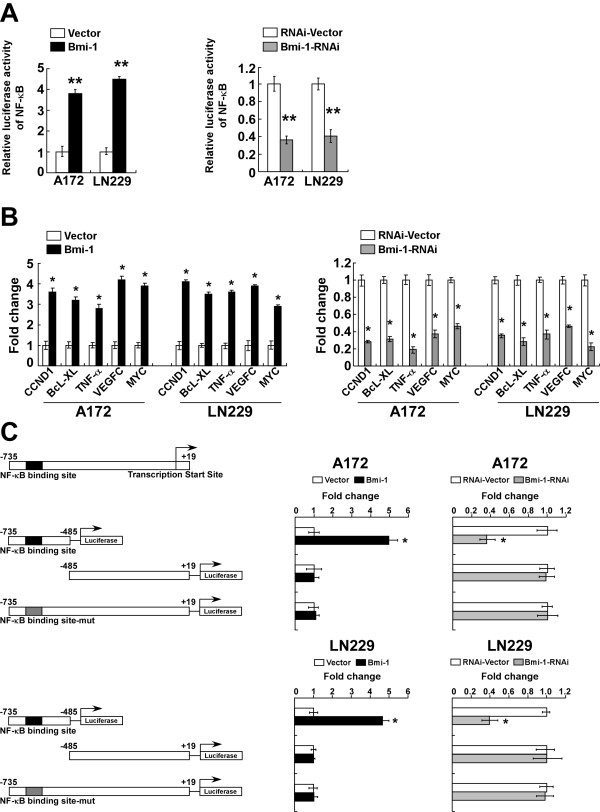
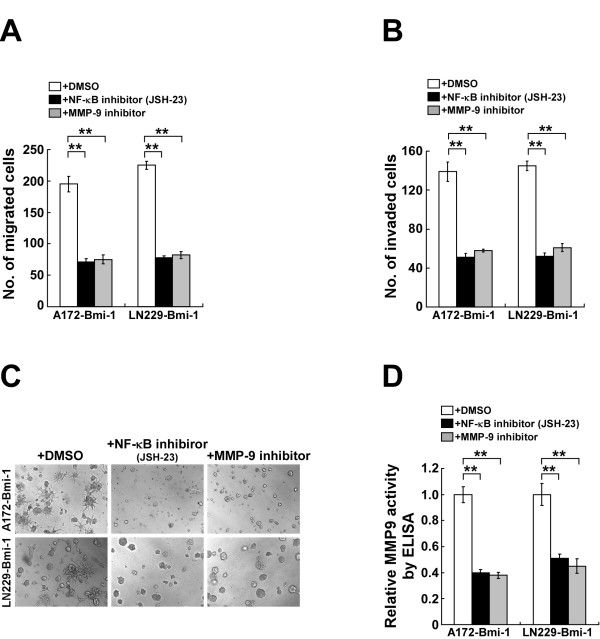
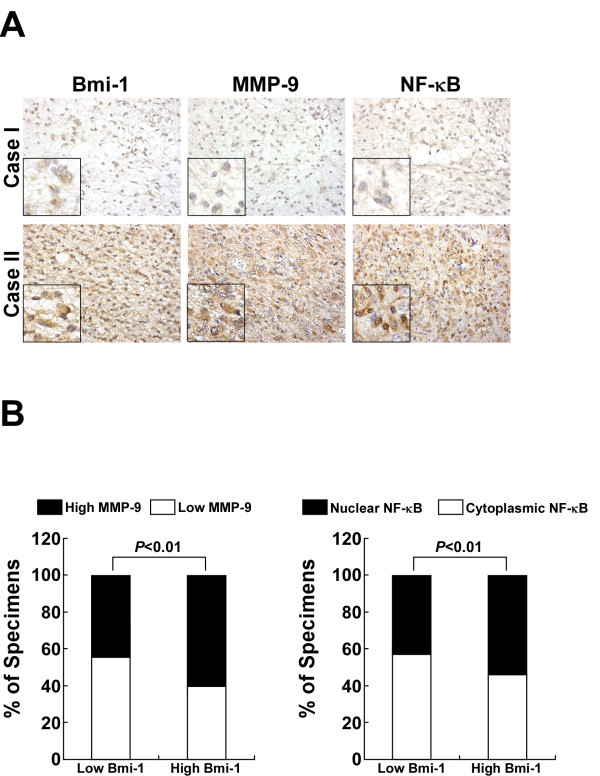
Results: Ectopic overexpression of Bmi-1 dramatically increased, whereas knockdown of endogenous Bmi-1 reduced, the invasiveness and migration of glioma cells. NF-kappaB transcriptional activity and MMP-9 expression and activity were significantly increased in Bmi-1-overexpressing but reduced in Bmi-1-silenced cells. The reporter luciferase activity driven by MMP-9 promoter in Bmi-1-overexpressing cells was dependent on the presence of a functional NF-kappaB binding site, and blockade of NF-kappaB signaling inhibited the upregulation of MMP-9 in Bmi-1 overexpressing cells. Furthermore, expression of Bmi-1 correlated with NF-kappaB nuclear translocation as well as MMP-9 expression in clinical glioma samples.
Conclusions: Bmi-1 may play an important role in the development of aggressive phenotype of glioma via activating the NF-kappaB/MMP-9 pathway and therefore might represent a novel therapeutic target for glioma.
Figures
Similar articles
-
A novel NF-κB/MMP-3 signal pathway involves in the aggressivity of glioma promoted by Bmi-1.Tumour Biol. 2014 Dec;35(12):12721-7. doi: 10.1007/s13277-014-2597-2. Epub 2014 Sep 25. Tumour Biol. 2014. PMID: 25252846
-
Bmi-1 promotes glioma angiogenesis by activating NF-κB signaling.PLoS One. 2013;8(1):e55527. doi: 10.1371/journal.pone.0055527. Epub 2013 Jan 31. PLoS One. 2013. PMID: 23383216 Free PMC article.
-
Down-modulation of Bis reduces the invasive ability of glioma cells induced by TPA, through NF-κB mediated activation of MMP-9.BMB Rep. 2014 May;47(5):262-7. doi: 10.5483/bmbrep.2014.47.5.172. BMB Rep. 2014. PMID: 24286317 Free PMC article.
-
Long Non-Coding RNA LINC01260 Inhibits the Proliferation, Migration and Invasion of Spinal Cord Glioma Cells by Targeting CARD11 Via the NF-κB Signaling Pathway.Cell Physiol Biochem. 2018;48(4):1563-1578. doi: 10.1159/000492279. Epub 2018 Aug 2. Cell Physiol Biochem. 2018. Retraction in: Cell Physiol Biochem. 2021;55(5):672. doi: 10.33594/000000462. PMID: 30071522 Retracted.
-
Knockdown of stomatin-like protein 2 (STOML2) reduces the invasive ability of glioma cells through inhibition of the NF-κB/MMP-9 pathway.J Pathol. 2012 Feb;226(3):534-43. doi: 10.1002/path.3008. Epub 2011 Dec 5. J Pathol. 2012. PMID: 21960069
Cited by
-
miR-135a Reduces Osteosarcoma Pulmonary Metastasis by Targeting Both BMI1 and KLF4.Front Oncol. 2021 Mar 22;11:620295. doi: 10.3389/fonc.2021.620295. eCollection 2021. Front Oncol. 2021. PMID: 33828977 Free PMC article.
-
CDKN2A (p16) mRNA decreased expression is a marker of poor prognosis in malignant high-grade glioma.Tumour Biol. 2015 Sep;36(10):7607-14. doi: 10.1007/s13277-015-3480-5. Epub 2015 Apr 29. Tumour Biol. 2015. PMID: 25921285
-
MiR-454-3p-Mediated Wnt/β-catenin Signaling Antagonists Suppression Promotes Breast Cancer Metastasis.Theranostics. 2019 Jan 1;9(2):449-465. doi: 10.7150/thno.29055. eCollection 2019. Theranostics. 2019. PMID: 30809286 Free PMC article.
-
Targeting of BMI-1 with PTC-209 shows potent anti-myeloma activity and impairs the tumour microenvironment.J Hematol Oncol. 2016 Mar 2;9:17. doi: 10.1186/s13045-016-0247-4. J Hematol Oncol. 2016. PMID: 26935956 Free PMC article.
-
Hypoxic exposure activates the B cell-specific Moloney murine leukaemia virus integration site 1/PI3K/Akt axis and promotes EMT in leukaemia stem cells.Oncol Lett. 2021 Feb;21(2):98. doi: 10.3892/ol.2020.12359. Epub 2020 Dec 8. Oncol Lett. 2021. PMID: 33376531 Free PMC article.
References
-
- Tektonidis M, Hatzikirou H, Chauviere A, Simon M, Schaller K, Deutsch A. Identification of intrinsic in vitro cellular mechanisms for glioma invasion. J Theor Biol. 2011;287:131–147. - PubMed
Publication types
MeSH terms
Substances
LinkOut - more resources
Full Text Sources
Miscellaneous
