

PET imaging reveals distinctive roles for different regional adipose tissue depots in systemic glucose metabolism in nonobese humans
- PMID: 22967498
- PMCID: PMC3492855
- DOI: 10.1152/ajpendo.00282.2012
PET imaging reveals distinctive roles for different regional adipose tissue depots in systemic glucose metabolism in nonobese humans
Abstract
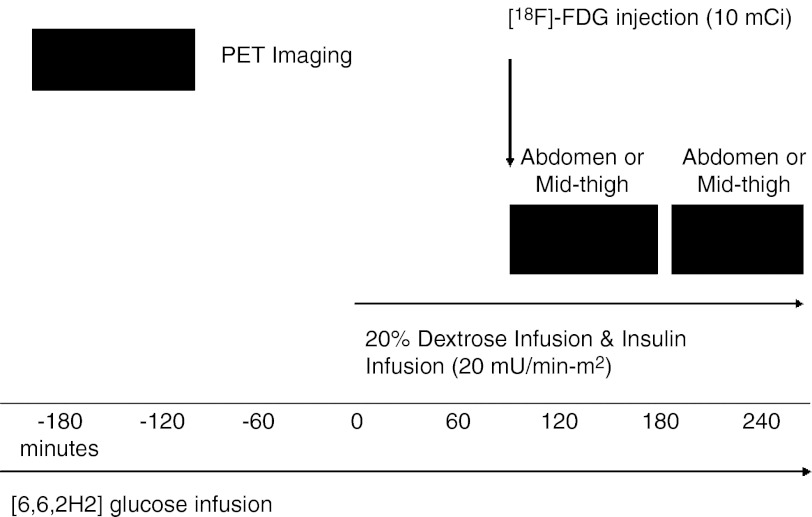
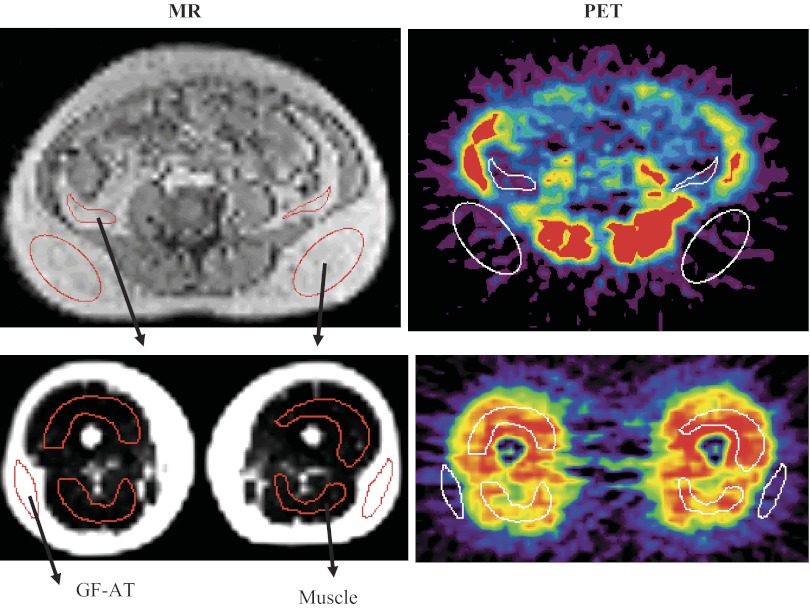
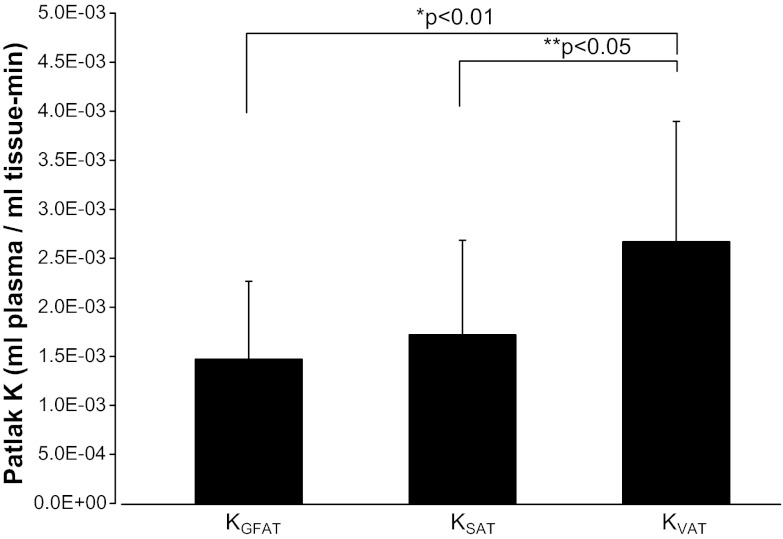
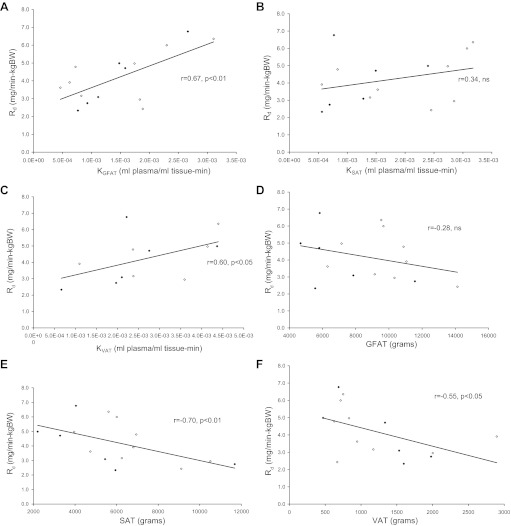
Excess amounts of abdominal subcutaneous (SAT) and visceral (VAT) adipose tissue (AT) are associated with insulin resistance, even in normal-weight subjects. In contrast, gluteal-femoral AT (GFAT) is hypothesized to offer protection against insulin resistance. Dynamic PET imaging studies were undertaken to examine the contributions of both metabolic activity and size (volume) of these depots in systemic glucose metabolism. Nonobese, healthy volunteers (n = 15) underwent dynamic PET imaging uptake of [¹⁸F]FDG at a steady-state (20 mU·m⁻²·min⁻¹) insulin infusion. PET images of tissue [¹⁸F]FDG activity were coregistered with MRI to derive K values for insulin-stimulated rates of fractional glucose uptake within tissue. Adipose tissue volume was calculated from DEXA and MRI. VAT had significantly higher rates of fractional glucose uptake per volume than SAT (P < 0.05) or GFAT (P < 0.01). K(GFAT) correlated positively (r = 0.67, P < 0.01) with systemic insulin sensitivity [glucose disappearance rate (R(d))] and negatively with insulin-suppressed FFA (r = -0.71, P < 0.01). SAT (r = -0.70, P < 0.01) and VAT mass (r = -0.55, P < 0.05) correlated negatively with R(d), but GFAT mass did not. We conclude that rates of fractional glucose uptake within GFAT and VAT are significantly and positively associated with systemic insulin sensitivity in nonobese subjects. Furthermore, whereas SAT and VAT amounts are confirmed to relate to systemic insulin resistance, GFAT amount is not associated with insulin resistance. These dynamic PET imaging studies indicate that both quantity and quality of specific AT depots have distinct roles in systemic insulin resistance and may help explain the metabolically obese but normal-weight phenotype.
Figures
References
-
- Amati F, Pennant M, Azuma K, Dubé JJ, Toledo FG, Rossi AP, Kelley DE, Goodpaster BH. Lower thigh subcutaneous and higher visceral abdominal adipose tissue content both contribute to insulin resistance. Obesity (Silver Spring) 20: 1115–1117, 2012 - PubMed
-
- Bertoldo A, Peltoniemi P, Oikonen V, Knuuti J, Nuutila P, Cobelli C. Kinetic modeling of [(18)F]FDG in skeletal muscle by PET: a four-compartment five-rate-constant model. Am J Physiol Endocrinol Metab 281: E524–E536, 2001 - PubMed
-
- Bier DM, Brosnan JT, Flatt JP, Hanson RW, Heird W, Hellerstein MK, Jéquier E, Kalhan S, Koletzko B, Macdonald I, Owen O, Uauy R. Report of the IDECG Working Group on lower and upper limits of carbohydrate and fat intake. International Dietary Energy Consultative Group. Eur J Clin Nutr 53, Suppl 1: S177–S178, 1999 - PubMed
-
- Bingley CA, Gitau R, Lovegrove JA. Impact of menstrual cycle phase on insulin sensitivity measures and fasting lipids. Horm Metab Res 40: 901–906, 2008 - PubMed
-
- Blaak E. Gender differences in fat metabolism. Curr Opin Clin Nutr Metab Care 4: 499–502, 2001 - PubMed
Publication types
MeSH terms
Substances
Grants and funding
LinkOut - more resources
Full Text Sources
Medical
Research Materials
Miscellaneous