

A rapid method for the differentiation of yeast cells grown under carbon and nitrogen-limited conditions by means of partial least squares discriminant analysis employing infrared micro-spectroscopic data of entire yeast cells
- PMID: 22967595
- PMCID: PMC3460240
- DOI: 10.1016/j.talanta.2012.06.036
A rapid method for the differentiation of yeast cells grown under carbon and nitrogen-limited conditions by means of partial least squares discriminant analysis employing infrared micro-spectroscopic data of entire yeast cells
Abstract
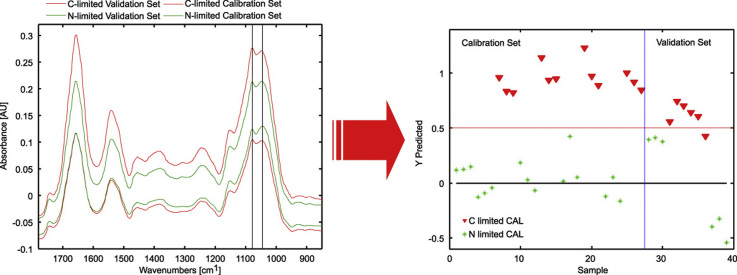
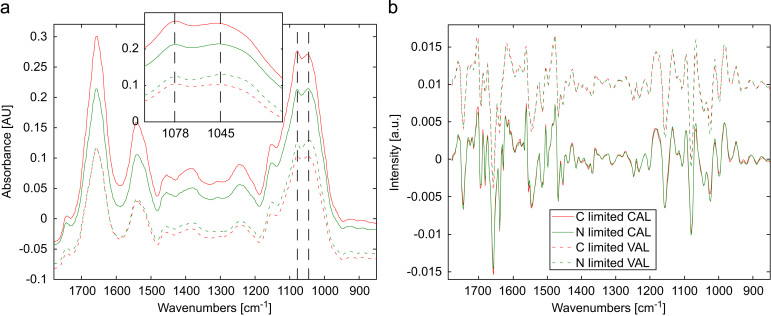
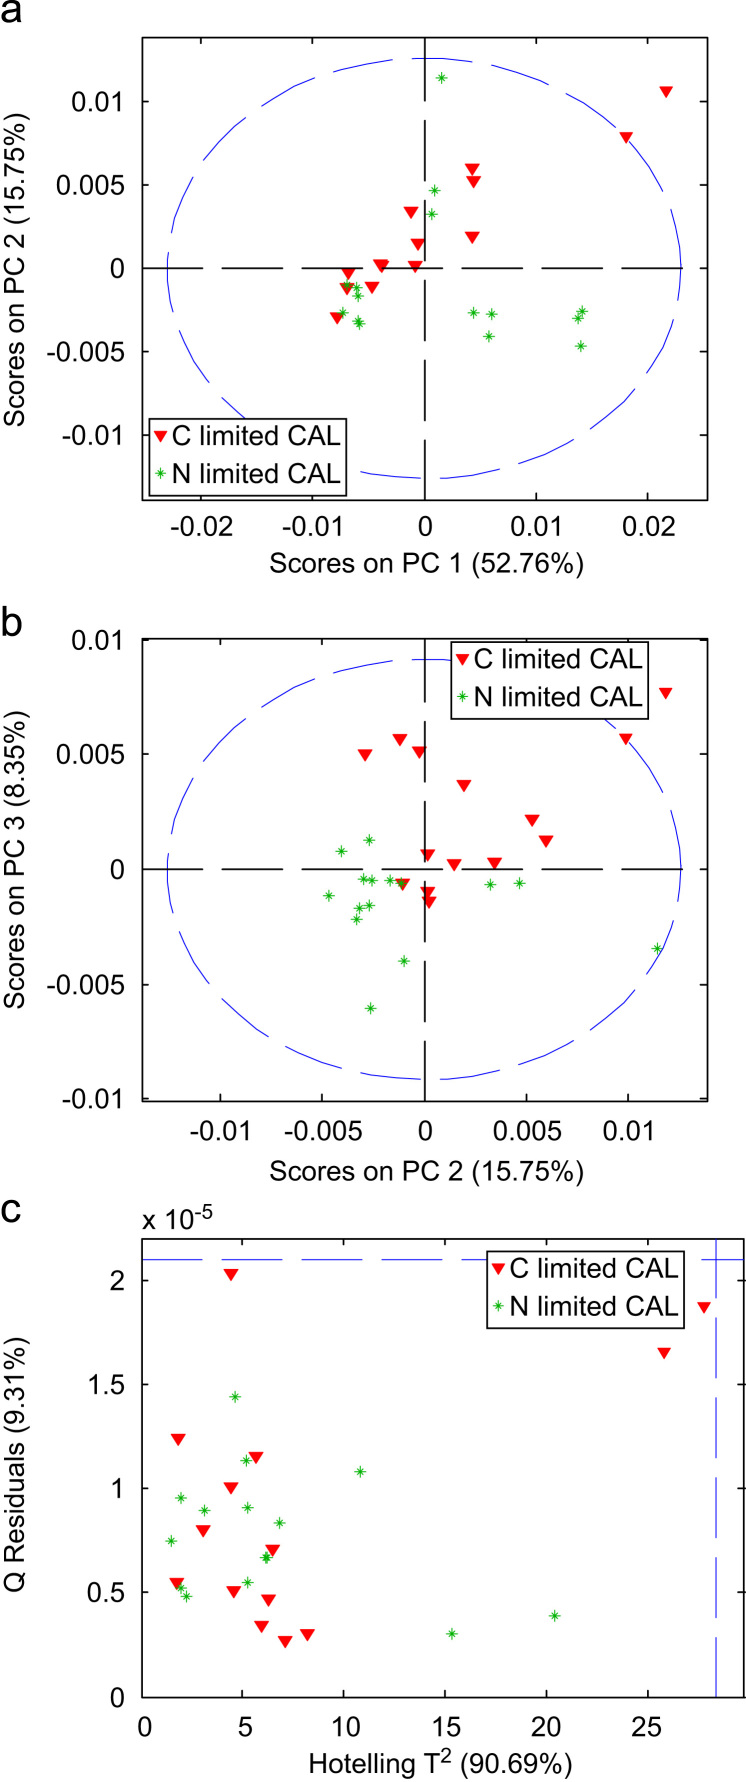
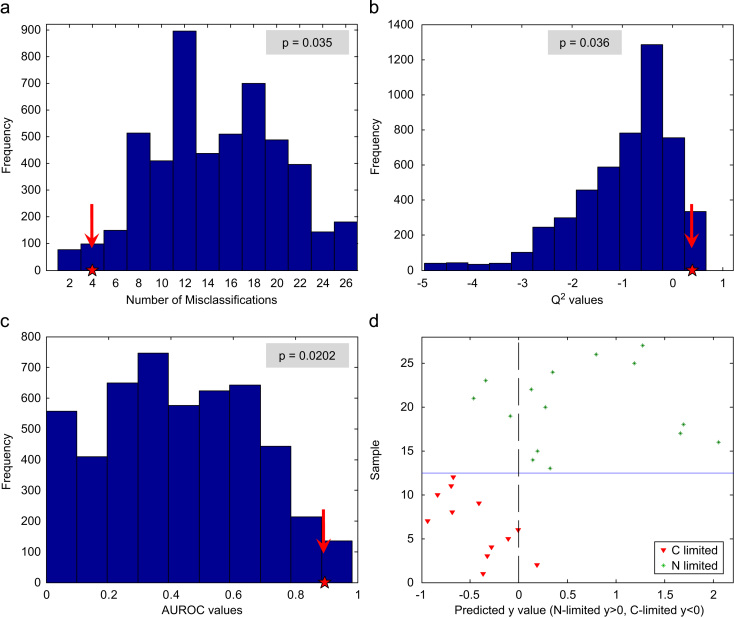
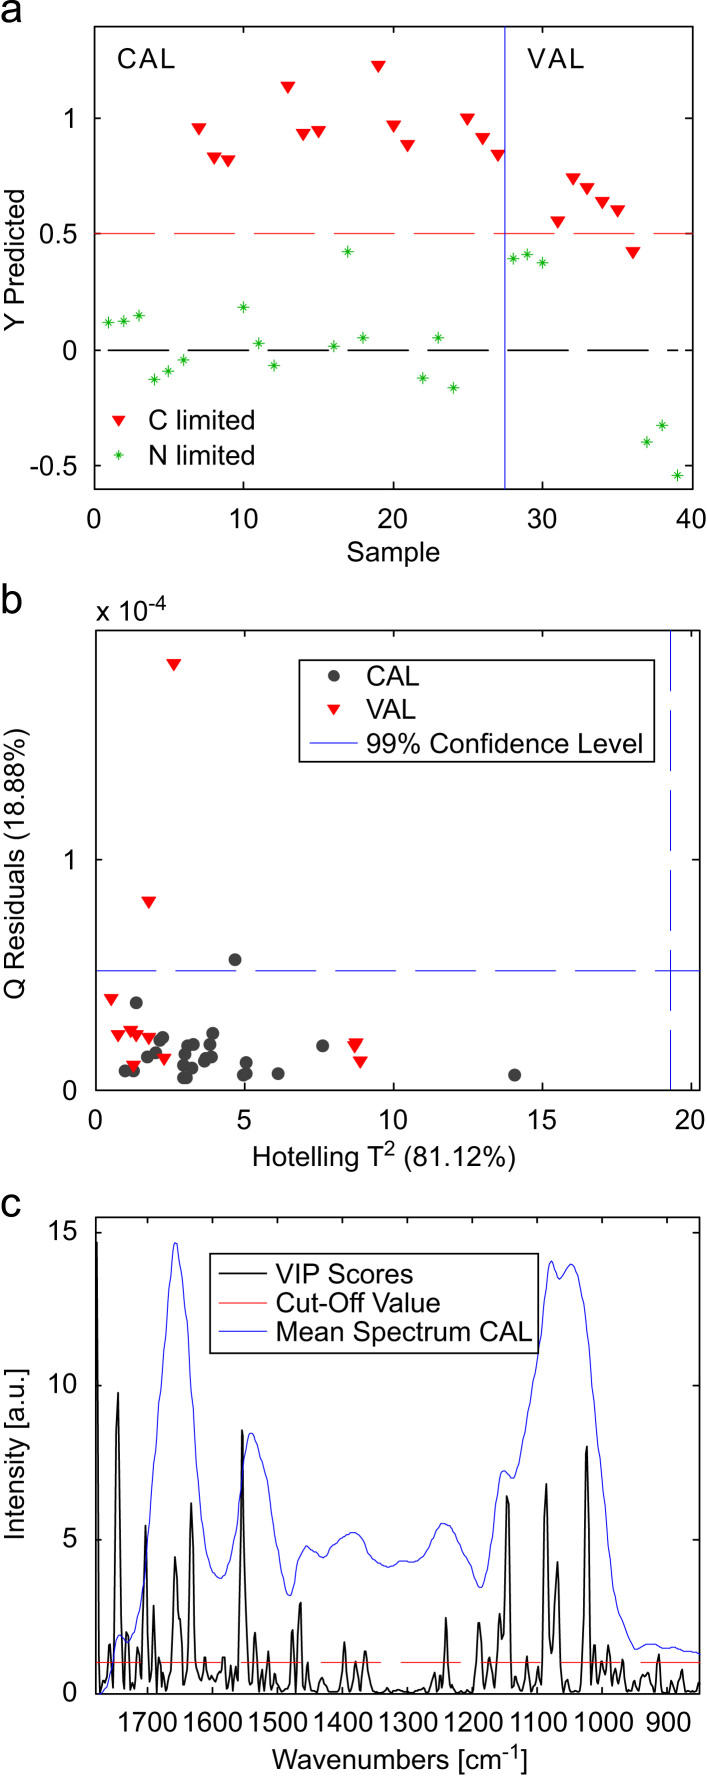
This paper shows the ease of application and usefulness of mid-IR measurements for the investigation of orthogonal cell states on the example of the analysis of Pichia pastoris cells. A rapid method for the discrimination of entire yeast cells grown under carbon and nitrogen-limited conditions based on the direct acquisition of mid-IR spectra and partial least squares discriminant analysis (PLS-DA) is described. The obtained PLS-DA model was extensively validated employing two different validation strategies: (i) statistical validation employing a method based on permutation testing and (ii) external validation splitting the available data into two independent sub-sets. The Variable Importance in Projection scores of the PLS-DA model provided deeper insight into the differences between the two investigated states. Hence, we demonstrate the feasibility of a method which uses IR spectra from intact cells that may be employed in a second step as an in-line tool in process development and process control along Quality by Design principles.
Copyright © 2012 Elsevier B.V. All rights reserved.
Figures
Similar articles
-
Method for identification of spectral targets in discrete frequency infrared spectroscopy for clinical diagnostics.Appl Spectrosc. 2015 Sep;69(9):1066-73. doi: 10.1366/14-07677. Epub 2015 Aug 6. Appl Spectrosc. 2015. PMID: 26253762
-
An extension to the discriminant analysis of near-infrared spectra.Med Eng Phys. 2013 Feb;35(2):172-7. doi: 10.1016/j.medengphy.2012.04.012. Epub 2012 May 29. Med Eng Phys. 2013. PMID: 22647838
-
Classification of structurally related commercial contrast media by near infrared spectroscopy.J Pharm Biomed Anal. 2014 Mar;90:148-60. doi: 10.1016/j.jpba.2013.11.033. Epub 2013 Dec 7. J Pharm Biomed Anal. 2014. PMID: 24374816
-
Two-dimensional hetero-spectral mid-infrared and near-infrared correlation spectroscopy for discrimination adulterated milk.Spectrochim Acta A Mol Biomol Spectrosc. 2016 Mar 15;157:50-54. doi: 10.1016/j.saa.2015.12.017. Epub 2015 Dec 15. Spectrochim Acta A Mol Biomol Spectrosc. 2016. PMID: 26714285
-
A tutorial review: Metabolomics and partial least squares-discriminant analysis--a marriage of convenience or a shotgun wedding.Anal Chim Acta. 2015 Jun 16;879:10-23. doi: 10.1016/j.aca.2015.02.012. Epub 2015 Feb 11. Anal Chim Acta. 2015. PMID: 26002472 Review.
Cited by
-
Integrated near-infrared spectral sensing.Nat Commun. 2022 Jan 10;13(1):103. doi: 10.1038/s41467-021-27662-1. Nat Commun. 2022. PMID: 35013200 Free PMC article.
-
Numerically stable locality-preserving partial least squares discriminant analysis for efficient dimensionality reduction and classification of high-dimensional data.Heliyon. 2024 Feb 12;10(4):e26157. doi: 10.1016/j.heliyon.2024.e26157. eCollection 2024 Feb 29. Heliyon. 2024. PMID: 38404905 Free PMC article.
-
Determination of carbohydrates present in Saccharomyces cerevisiae using mid-infrared spectroscopy and partial least squares regression.Anal Bioanal Chem. 2013 Oct;405(25):8241-50. doi: 10.1007/s00216-013-7239-9. Epub 2013 Aug 21. Anal Bioanal Chem. 2013. PMID: 23963571 Free PMC article.
-
Handheld NIR Spectral Sensor Module Based on a Fully-Integrated Detector Array.Sensors (Basel). 2022 Sep 16;22(18):7027. doi: 10.3390/s22187027. Sensors (Basel). 2022. PMID: 36146377 Free PMC article.
-
Quantifying the Abundance of Alkane Moieties in Lignins with FTIR Spectroscopy and PLS Regression; Estimating Grafting Degree of Esterification.ChemSusChem. 2025 Feb 1;18(3):e202400938. doi: 10.1002/cssc.202400938. Epub 2024 Nov 5. ChemSusChem. 2025. PMID: 39301760 Free PMC article.
References
-
- Naumann D. Infrared spectrsocopy in microbiology. In: Meyers R.A., editor. Encyclopedia of Analytical Chemistry. John Wiley & Sons; Chichester, UK: 2000.
-
- Beekes M., Lasch P., Naumann D. Vet. Microbiol. 2007;123:305–319. - PubMed
-
- Wang L.Q., Mizaikoff B. Anal. Bioanal.Chem. 2008;391:1641–1654. - PubMed
-
- Galichet A., Sockalingum G.D., Belarbi A., Manfait M. FEMS Microbiol. Lett. 2001;197:179–186. - PubMed
Publication types
MeSH terms
Substances
LinkOut - more resources
Full Text Sources
