

An integrated approach to identify causal network modules of complex diseases with application to colorectal cancer
- PMID: 22967703
- PMCID: PMC3721155
- DOI: 10.1136/amiajnl-2012-001168
An integrated approach to identify causal network modules of complex diseases with application to colorectal cancer
Abstract
Background: Many methods have been developed to identify disease genes and further module biomarkers of complex diseases based on gene expression data. It is generally difficult to distinguish whether the variations in gene expression are causative or merely the effect of a disease. The limitation of relying on gene expression data alone highlights the need to develop new approaches that can explore various data to reflect the casual relationship between network modules and disease traits.
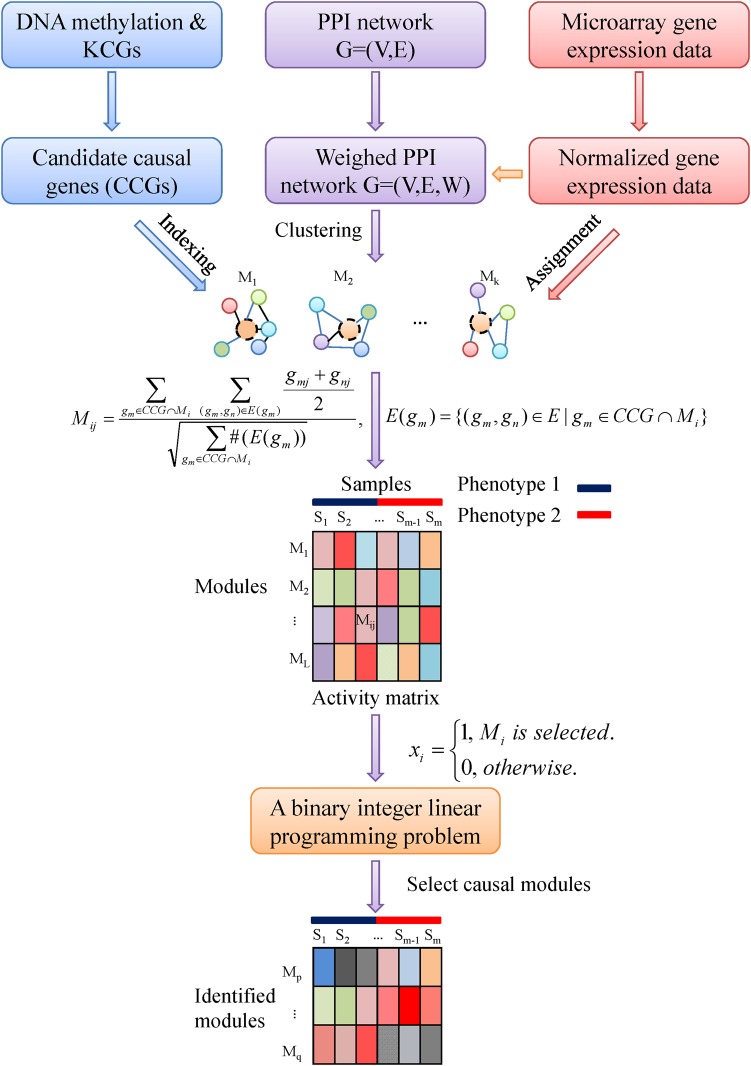
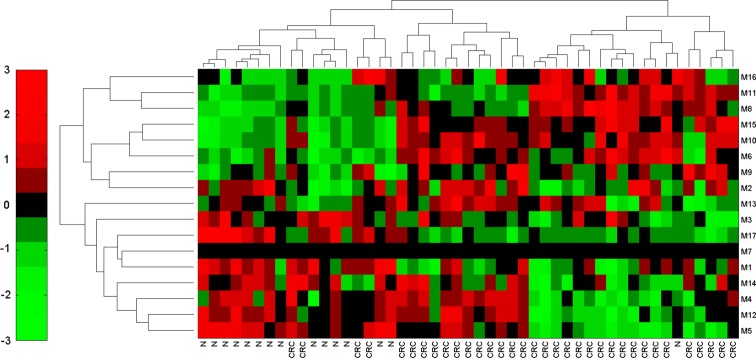
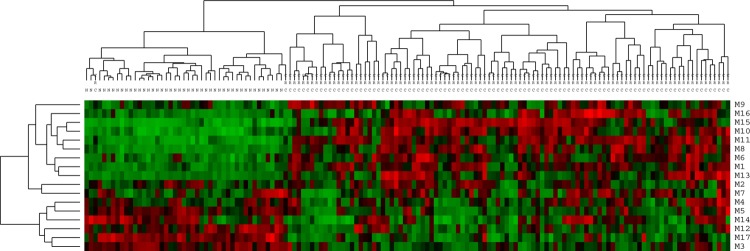
Methods: In this work, we developed a novel network-based approach to identify putative causal module biomarkers of complex diseases by integrating heterogeneous information, for example, epigenomic data, gene expression data, and protein-protein interaction network. We first formulated the identification of modules as a mathematical programming problem, which can be solved efficiently and effectively in an accurate manner. Then, we applied our approach to colorectal cancer (CRC) and identified several network modules that can serve as potential module biomarkers for characterizing CRC. Further validations using three additional gene expression datasets verified their candidate biomarker properties and the effectiveness of the method. Functional enrichment analysis also revealed that the identified modules are strongly related to hallmarks of cancer, and the enriched functions, such as inflammatory response, receptor and signaling pathways, are specific to CRC.
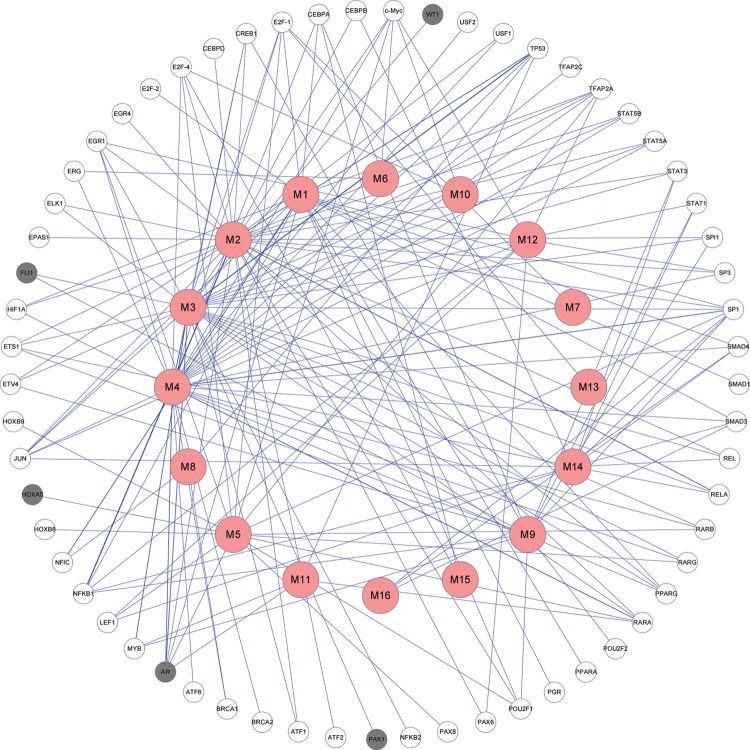
Results: Through constructing a transcription factor (TF)-module network, we found that aberrant DNA methylation of genes encoding TF considerably contributes to the activity change of some genes, which may function as causal genes of CRC, and that can also be exploited to develop efficient therapies or effective drugs.
Conclusion: Our method can potentially be extended to the study of other complex diseases and the multiclassification problem.
Figures
Similar articles
-
Impact of Colon-Specific DNA Methylation-Regulated Gene Modules on Colorectal Cancer Patient Survival.Med Sci Monit. 2019 May 13;25:3549-3557. doi: 10.12659/MSM.916181. Med Sci Monit. 2019. PMID: 31083646 Free PMC article.
-
Identification of key gene modules and genes in colorectal cancer by co-expression analysis weighted gene co-expression network analysis.Biosci Rep. 2020 Sep 30;40(9):BSR20202044. doi: 10.1042/BSR20202044. Biosci Rep. 2020. PMID: 32815531 Free PMC article.
-
Application of weighted gene co‑expression network analysis to explore the potential diagnostic biomarkers for colorectal cancer.Mol Med Rep. 2020 Jun;21(6):2533-2543. doi: 10.3892/mmr.2020.11047. Epub 2020 Apr 1. Mol Med Rep. 2020. PMID: 32323816 Free PMC article.
-
Walking pathways with positive feedback loops reveal DNA methylation biomarkers of colorectal cancer.BMC Bioinformatics. 2019 Apr 18;20(Suppl 4):119. doi: 10.1186/s12859-019-2687-7. BMC Bioinformatics. 2019. PMID: 30999858 Free PMC article.
-
Network-Based Combinatorial CRISPR-Cas9 Screens Identify Synergistic Modules in Human Cells.ACS Synth Biol. 2019 Mar 15;8(3):482-490. doi: 10.1021/acssynbio.8b00237. Epub 2019 Feb 21. ACS Synth Biol. 2019. PMID: 30762338
Cited by
-
Systems biology: perspectives on multiscale modeling in research on endocrine-related cancers.Endocr Relat Cancer. 2019 Jun;26(6):R345-R368. doi: 10.1530/ERC-18-0309. Endocr Relat Cancer. 2019. PMID: 30965282 Free PMC article. Review.
-
Drug repositioning framework by incorporating functional information.IET Syst Biol. 2013 Oct;7(5):188-94. doi: 10.1049/iet-syb.2012.0064. IET Syst Biol. 2013. PMID: 24067419 Free PMC article.
-
Gender-specific DNA methylome analysis of a Han Chinese longevity population.Biomed Res Int. 2014;2014:396727. doi: 10.1155/2014/396727. Epub 2014 Apr 14. Biomed Res Int. 2014. PMID: 24822201 Free PMC article.
-
Detecting early-warning signals of type 1 diabetes and its leading biomolecular networks by dynamical network biomarkers.BMC Med Genomics. 2013;6 Suppl 2(Suppl 2):S8. doi: 10.1186/1755-8794-6-S2-S8. Epub 2013 May 7. BMC Med Genomics. 2013. PMID: 23819540 Free PMC article.
-
Efficient and biologically relevant consensus strategy for Parkinson's disease gene prioritization.BMC Med Genomics. 2016 Mar 9;9:12. doi: 10.1186/s12920-016-0173-x. BMC Med Genomics. 2016. PMID: 26961748 Free PMC article.
References
-
- Hunter DJ. Gene–environment interactions in human diseases. Nat Rev Genet 2005;6:287–98 - PubMed
-
- Schadt EE. Molecular networks as sensors and drivers of common human diseases. Nature 2009;461:218–23 - PubMed
-
- Alizadeh AA, Eisen MB, Davis RE, et al. Distinct types of diffuse large B-cell lymphoma identified by gene expression profiling. Nature 2000;403:503–11 - PubMed
-
- Golub TR, Slonim DK, Tamayo P, et al. Molecular classification of cancer: class discovery and class prediction by gene expression monitoring. Science 1999;286:531–7 - PubMed
-
- Barabasi AL, Oltvai ZN. Network biology: understanding the cell's functional organization. Nat Rev Genet 2004;5:101–13 - PubMed
Publication types
MeSH terms
Substances
LinkOut - more resources
Full Text Sources
Other Literature Sources
Medical
Miscellaneous
