

Myoelectric activity along human gastrocnemius medialis: different spatial distributions of postural and electrically elicited surface potentials
- PMID: 22967836
- PMCID: PMC3566583
- DOI: 10.1016/j.jelekin.2012.08.003
Myoelectric activity along human gastrocnemius medialis: different spatial distributions of postural and electrically elicited surface potentials
Abstract
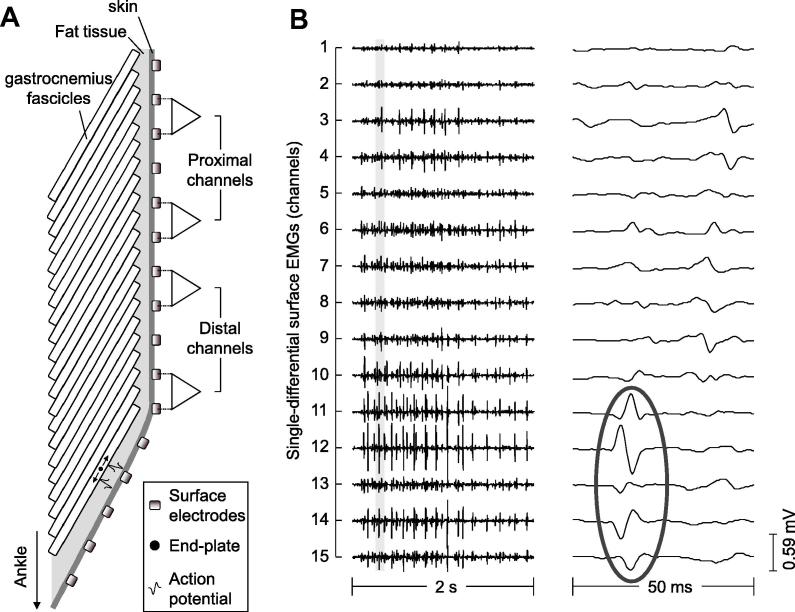
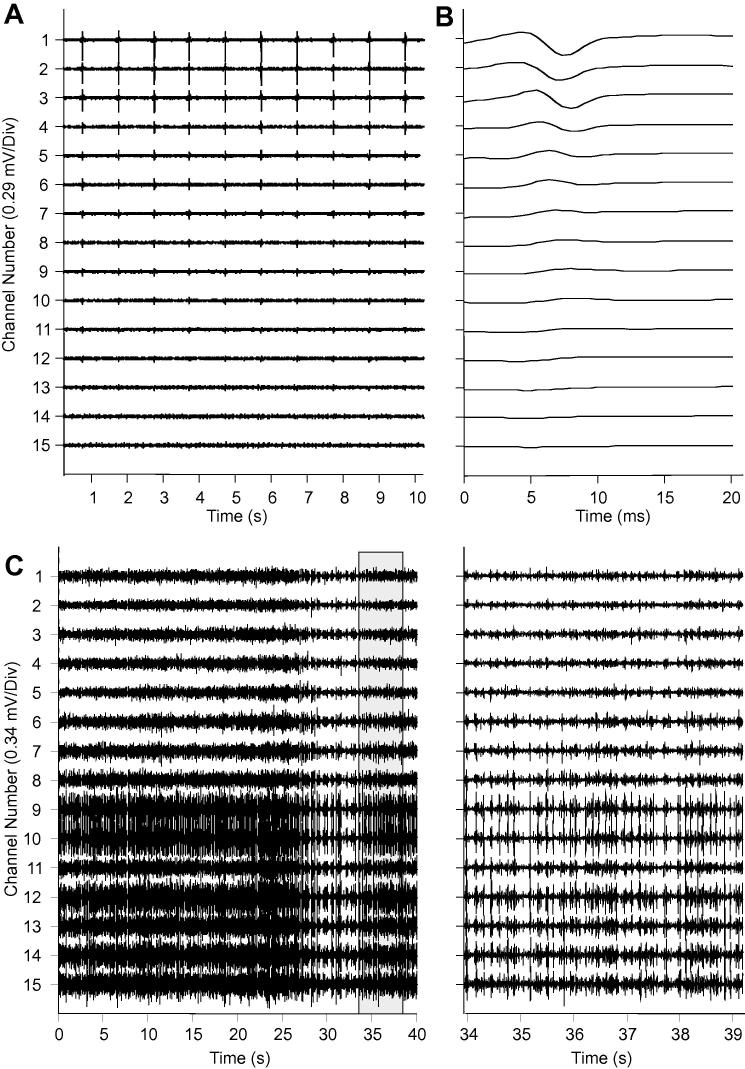
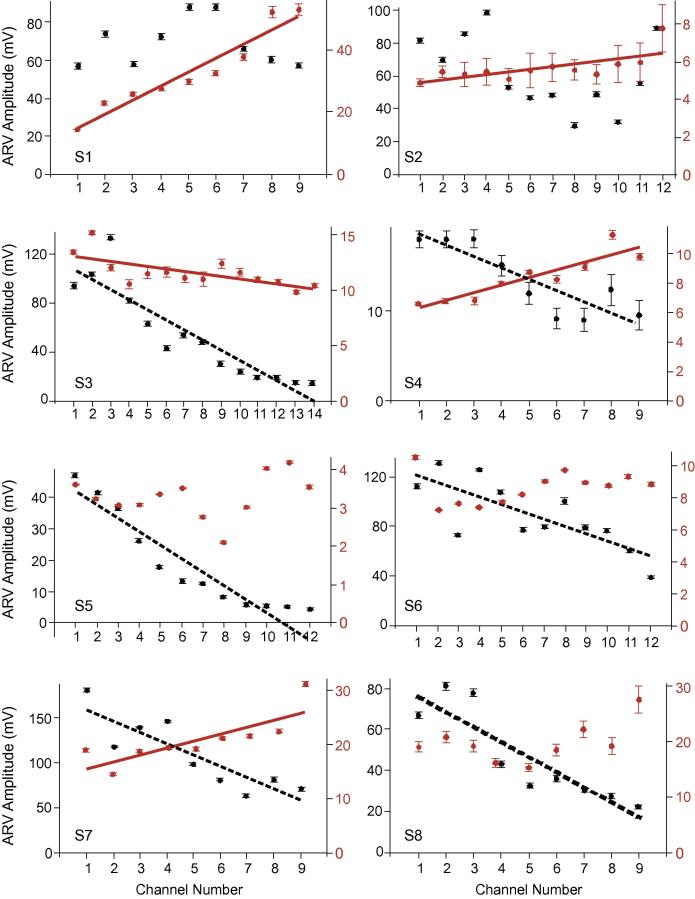
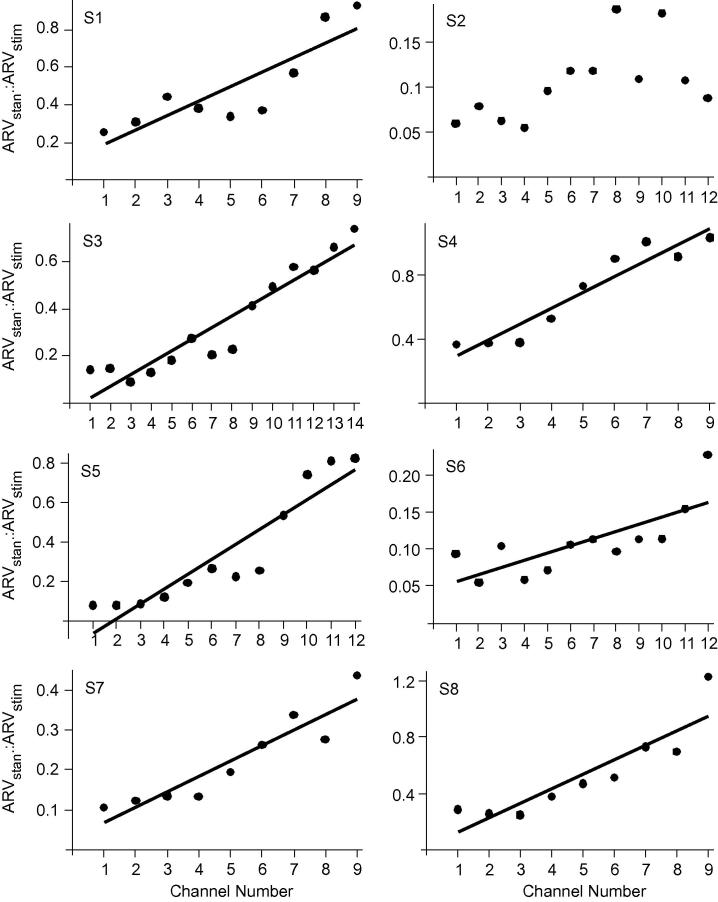
It has recently been shown that motor units in human medial gastrocnemius (MG), activated during standing, occupy relatively small territories along the muscle's longitudinal axis. Such organisation provides potential for different motor tasks to produce differing regional patterns of activity. Here, we investigate whether postural control and nerve electrical stimulation produce equal longitudinal activation patterns in MG. Myoelectric activity, at different proximal-distal locations of MG, was recorded using a linear electrode array. To ensure differences in signal amplitude between channels did not result from local, morphological factors two experimental protocols were completed: (i) quiet standing; (ii) electrical stimulation of the tibial nerve. Averaged, rectified values (ARVs) were calculated for each channel in each condition. The distribution of signals along electrode channels was described using linear regression and differences between protocols at each channel determined as the ratio between mean ARV from standing: stimulation protocols. Ratio values changed systematically across electrode channels in seven (of eight) participants, with larger values in distal channels. The distribution of ARV along MG therefore differed between experimental conditions. Compared to fibres of units activated during MG nerve stimulation, units activated during standing may have a tendency to be more highly represented in the distal muscle portion.
Copyright © 2012 Elsevier Ltd. All rights reserved.
Figures
References
-
- Brown J.M.M., Wickham J.B., McAndrew D.J., Huang X.F. Muscles within muscles: Coordination of 19 muscle segments within three shoulder muscles during isometric motor tasks. J Electromyogr Kinesiol. 2007;17(1):57–73. - PubMed
-
- DeRuiter C.J., De Haan A., Sargeant A.J. Physiological characteristics of two extreme muscle compartments in gastrocnemius medialis of the anaesthetized rat. Acta Physiol Scand. 1995;153:313–324. - PubMed
-
- English A., Wolf S.L., Segal R.L. Compartmentalization of muscles and their motor nuclei: the partitioning hypothesis. Phys Ther. 1993;73:857–867. - PubMed
-
- Faul F., Erdfelder E., Lang A.-G., Buchner A. G∗Power 3: a flexible statistical power analysis program for the social, behavioural and biomedical sciences. Behav Res Methods. 2007;39(2):175–191. - PubMed
-
- Faul F., Erdfelder E., Buchner A., Lang A.-G. Statistical power analyses using G∗Power 3.1: tests for correlation and regression analyses. Behav Res Methods. 2009;41(4):1149–1160. - PubMed
Publication types
MeSH terms
Grants and funding
LinkOut - more resources
Full Text Sources
Other Literature Sources
Medical
