. 2012 Sep 11;31(1):72.
doi: 10.1186/1756-9966-31-72.

Mechanisms involved in PGE2-induced transactivation of the epidermal growth factor receptor in MH1C1 hepatocarcinoma cells

Affiliations

Mechanisms involved in PGE2-induced transactivation of the epidermal growth factor receptor in MH1C1 hepatocarcinoma cells

Ingun Heiene Tveteraas et al. J Exp Clin Cancer Res. .

Abstract

Background: It is important to understand the mechanisms by which the cells integrate signals from different receptors. Several lines of evidence implicate epidermal growth factor (EGF) receptor (EGFR) in the pathophysiology of hepatocarcinomas. Data also suggest a role of prostaglandins in some of these tumours, through their receptors of the G protein-coupled receptor (GPCR) family. In this study we have investigated mechanisms of interaction between signalling from prostaglandin receptors and EGFR in hepatocarcinoma cells.

Methods: The rat hepatocarcinoma cell line MH1C1 and normal rat hepatocytes in primary culture were stimulated with EGF or prostaglandin E2 (PGE2) and in some experiments also PGF2α. DNA synthesis was determined by incorporation of radiolabelled thymidine into DNA, phosphorylation of proteins in signalling pathways was assessed by Western blotting, mRNA expression of prostaglandin receptors was determined using qRT-PCR, accumulation of inositol phosphates was measured by incorporation of radiolabelled inositol, and cAMP was determined by radioimmunoassay.

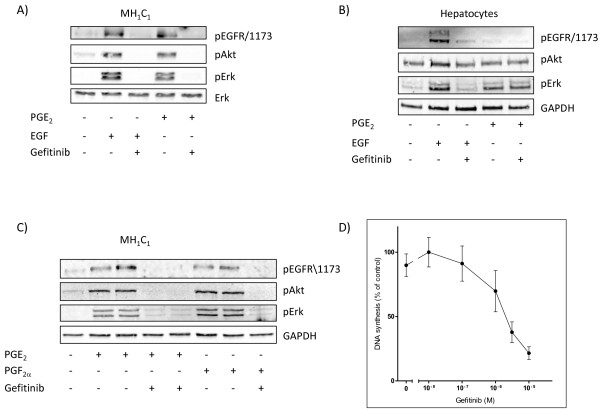
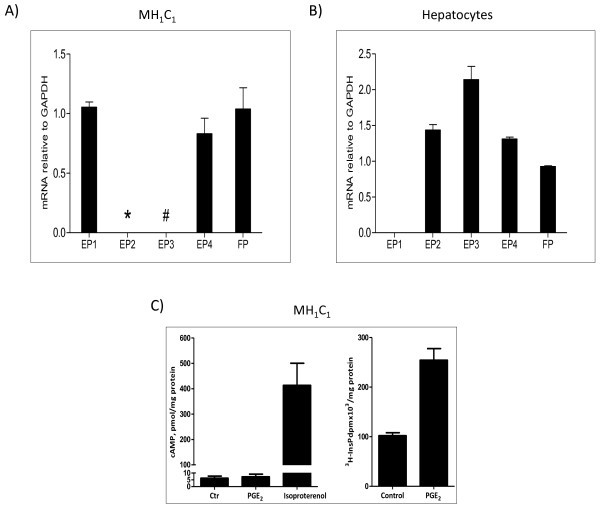
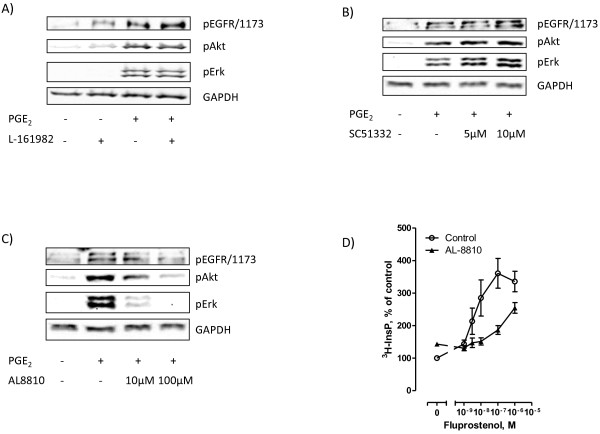
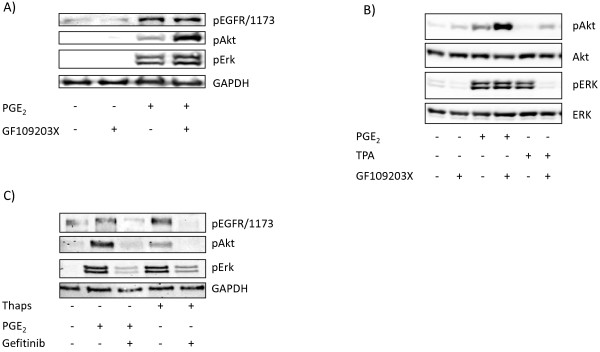
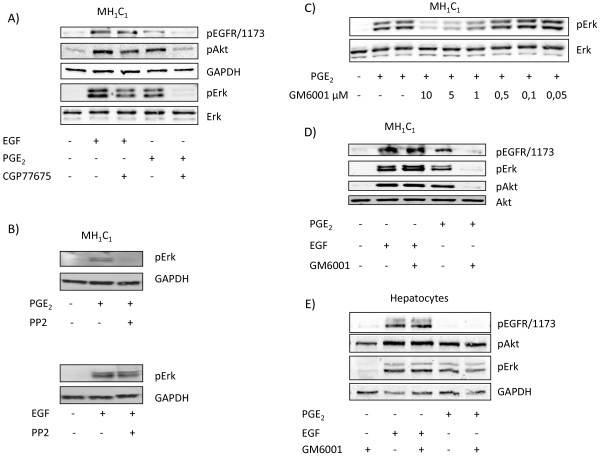
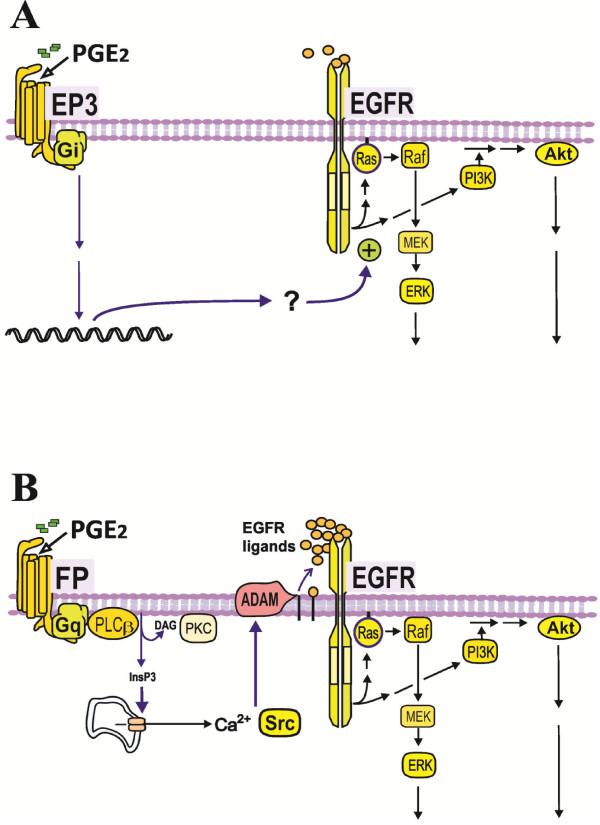
Results: In the MH1C1 hepatocarcinoma cells, stimulation with PGE2 or PGF2α caused phosphorylation of the EGFR, Akt, and ERK, which could be blocked by the EGFR tyrosine kinase inhibitor gefitinib. This did not occur in primary hepatocytes. qRT-PCR revealed expression of EP1, EP4, and FP receptor mRNA in MH1C1 cells. PGE2 stimulated accumulation of inositol phosphates but not cAMP in these cells, suggesting signalling via PLCβ. While pretreatment with EP1 and EP4 receptor antagonists did not inhibit the effect of PGE2, pretreatment with an FP receptor antagonist blocked the phosphorylation of EGFR, Akt and ERK. Further studies suggested that the PGE2-induced signal was mediated via Ca2+ release and not PKC activation, and that it proceeded through Src and shedding of membrane-bound EGFR ligand precursors by proteinases of the ADAM family.

Conclusion: The results indicate that in MH1C1 cells, unlike normal hepatocytes, PGE2 activates the MEK/ERK and PI3K/Akt pathways by transactivation of the EGFR, thus diversifying the GPCR-mediated signal. The data also suggest that the underlying mechanisms in these cells involve FP receptors, PLCβ, Ca2+, Src, and proteinase-mediated release of membrane-associated EGFR ligand(s).


Figures

Figure 1
Figure 1
Effects of the EGFR inhibitor gefitinib on phosphorylation of signalling proteins and DNA synthesis. A) MH1C1 cells were treated with gefitinib (1 μM) for 30 min before stimulation with EGF (10 nM) or PGE2 (100 μM) for 5 min. B) Hepatocytes were treated with gefitinib (1 μM) for 30 min before stimulation with EGF (10 nM) or PGE2 (100 μM) for 5 min. C) Gefitinib (1 μM) was added 30 min prior to stimulation with either PGE2 (100 μM) or PGF (100 μM) for 5 min. Cells were harvested and subjected to SDS-PAGE followed by immunoblotting with antibodies and detection with enhanced chemiluminescence as described in Materials and Methods. All blots are representative of at least 3 independent experiments. D) Effect of gefitinib on DNA synthesis in MH1C1 cells. Increasing concentrations of gefitinib were added to serum-starved MH1C1 cells. [3 H]thymidine was added, and DNA synthesis was assessed as described under Materials and Methods. The results are presented as percent of control ± S.E.M of four independent experiments.
Figure 2
Figure 2
Prostaglandin receptors and cAMP and PLCβ responses. A) and B) Expression of prostaglandin receptor mRNA in MH1C1 cells (data from three experiments, measured in triplicate) and hepatocytes (data from one experiment measured in triplicate). Quantitative RT-PCR of EP1, EP2, EP3, EP4 and FP normalized to GADPH. RNA was isolated as described in Materials and Methods. * not detected # low levels-not quantifiable. C) Left: Accumulation of cAMP in MH1C1 cells after stimulation with either PGE2 (100 μM) or isoproterenol (10 μM) in the presence of 0.5 mM IBMX. cAMP was measured after 3 minutes. Right: Accumulation of inositol phosphates in MH1C1 cells after stimulation with PGE2 (100 μM) for 30 minutes in the presence of 15 mM LiCl. The data shown are mean ± S.E.M of three independent experiments.
Figure 3
Figure 3
Effect of different prostaglandin receptor inhibitors in MH1C1 cells. A) The EP4 inhibitor L-161982 (10 μM) was added 30 min prior to stimulation with PGE2 (100 μM) for 5 min. B) The EP1 inhibitor SC51322 (5 or 10 μM) was added 30 minutes prior to stimulation with PGE2 (100 μM) for 5 min. C) The FP inhibitor AL8810 (10 or 100 μM) was added 30 minutes prior to stimulation with PGE2 (100 μM) for 5 min. All blots are representative of three independent experiments. D) Effect of AL8810 (100 μM) on accumulation of inositol phosphates after stimulation with increasing concentrations of fluprostenol for 30 minutes in the presence of 15 mM LiCl. The data shown are mean ± S.E.M of four independent experiments.
Figure 4
Figure 4
Role of Ca2+ and PKC in responses to PGE2 in MH1C1 cells. A) MH1C1 cells were pretreated for 30 min with the PKC inhibitor GF109203X (3.5 μM) before stimulation with PGE2 (100 μM) for 5 min. B) MH1C1 cells were pretreated for 30 min with the PKC inhibitor GF109203X (3.5 μM) before stimulation with PGE2 (100 μM) or TPA (1 μM) for 5 min. C) MH1C1 cells were treated with gefitinib (1µM) for 30 min before stimulation with either PGE2 (100 μM) or thapsigargin (1 μM) for 5 min. Cells were then harvested and subjected to immunoblot analysis as described in Materials and Methods. Representative blots of at least three experiments.
Figure 5
Figure 5
Effect of Src and MMP inhibitors on phosphorylation of EGFR and downstream targets. A) MH1C1 cells were pretreated for 90 min with the Src inhibitor CGP 77675 (10 μM). Cells were then stimulated with either PGE2 (100 μM) or EGF (10 nM) for 5 min before they were harvested and immunoblotting performed as described in Materials and Methods. Representative blots of at least three experiments. B) MH1C1 cells were pretreated for 30 min with the Src inhibitor PP2 (10 μM). Cells were then stimulated with either PGE2 (100 μM) or EGF (10 nM) for 5 min before they were harvested and immunoblotting performed as described in Materials and Methods. Representative blots of two experiments. C) MH1C1 cells were pretreated for 30 min with increasing concentrations of the metalloproteinase inhibitor GM6001. Cells were then stimulated with PGE2 (100 μM) for 5 min before they were harvested and immunoblotting performed as described in Materials and Methods. Representative blots of three experiments D) MH1C1 cells were pretreated for 30 min with the metalloproteinase inhibitor GM6001 (10 μM). Cells were then stimulated with either PGE2 (100 μM) or EGF (10 nM) for five minutes before they were harvested and immunoblotting performed as described in Materials and Methods. Representative blots of at least three experiments E) Same experiment as in D) performed in hepatocytes. Representative blots of at least three experiments.
Figure 6
Figure 6
Mechanisms by which PGE2 interacts with EGFR-mediated signalling in hepatocytes and MH1C1 hepatocarcinoma cells. A) In normal rat hepatocytes, PGE2 does not elicit transactivation of EGFR, but induces upregulation of the effectiveness in Ras/ERK and PI3K/Akt pathways downstream of EGFR, leading to an enhanced mitogenic response to EGF family growth factors [37,38,51]. Although not fully clarified, previous studies have indicated that this effect of PGE2 is mediated primarily through EP3 receptors and Gi proteins, requires several hours to develop, and is most likely a result of altered gene expression [34,37,38,51,52]. B) In MH1C1 rat hepatocarcinoma cells, PGE2 transactivates EGFR and thereby activates the Ras/ERK and PI3K/Akt signalling pathways. The results of the present study suggest that this effect is exerted via FP receptors, Gq proteins, PLCβ, intracellular Ca2+ (but not PKC), Src, and ADAM-mediated release of EGFR ligands.

Similar articles

Cited by

References

    1. Daub H, Weiss FU, Wallasch C, Ullrich A. Role of transactivation of the EGF receptor in signalling by G-protein-coupled receptors. Nature. 1996;379(6565):557–560. doi: 10.1038/379557a0. - DOI - PubMed
    1. Prenzel N, Zwick E, Daub H, Leserer M, Abraham R, Wallasch C, Ullrich A. EGF receptor transactivation by G-protein-coupled receptors requires metalloproteinase cleavage of proHB-EGF. Nature. 1999;402(6764):884–888. - PubMed
    1. Buchanan FG, Wang D, Bargiacchi F, DuBois RN. Prostaglandin E2 regulates cell migration via the intracellular activation of the epidermal growth factor receptor. J Biol Chem. 2003;278(37):35451–35457. doi: 10.1074/jbc.M302474200. - DOI - PubMed
    1. Schafer B, Marg B, Gschwind A, Ullrich A. Distinct ADAM metalloproteinases regulate G protein-coupled receptor-induced cell proliferation and survival. J Biol Chem. 2004;279(46):47929–47938. doi: 10.1074/jbc.M400129200. - DOI - PubMed
    1. Bhola NE, Grandis JR. Crosstalk between G-protein-coupled receptors and epidermal growth factor receptor in cancer. Front Biosci. 2008;13:1857–1865. doi: 10.2741/2805. - DOI - PubMed

Publication types

MeSH terms