. 2012:8:608.
doi: 10.1038/msb.2012.40.

Global analysis of genome, transcriptome and proteome reveals the response to aneuploidy in human cells

Affiliations

Global analysis of genome, transcriptome and proteome reveals the response to aneuploidy in human cells

Silvia Stingele et al. Mol Syst Biol. 2012.

Abstract

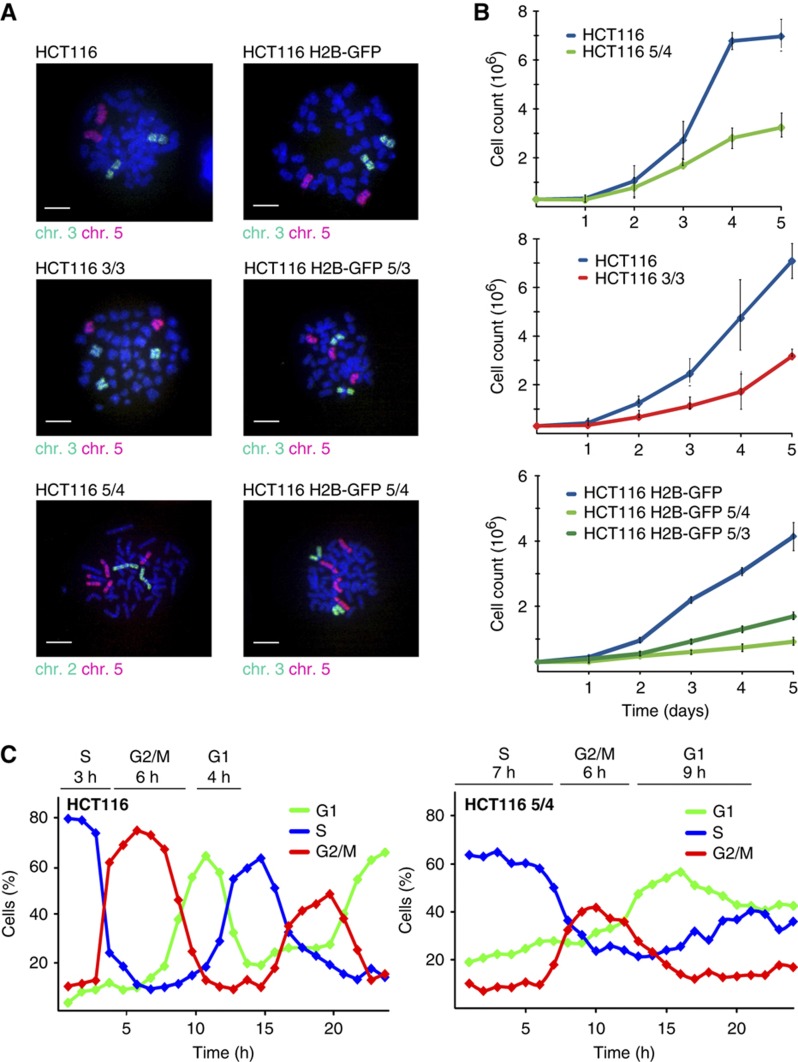
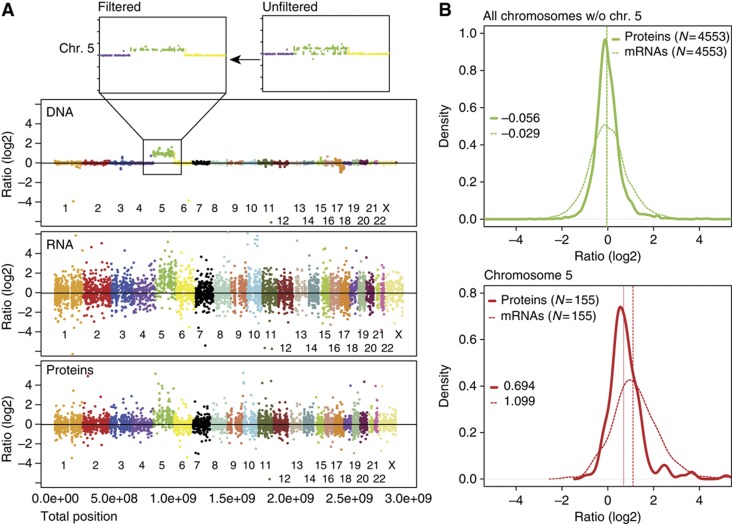
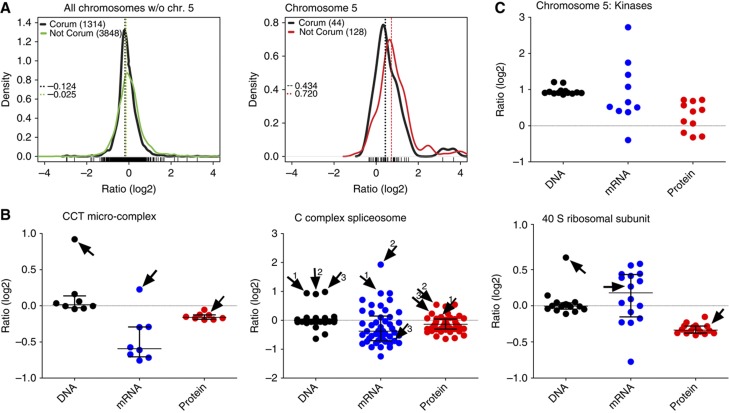
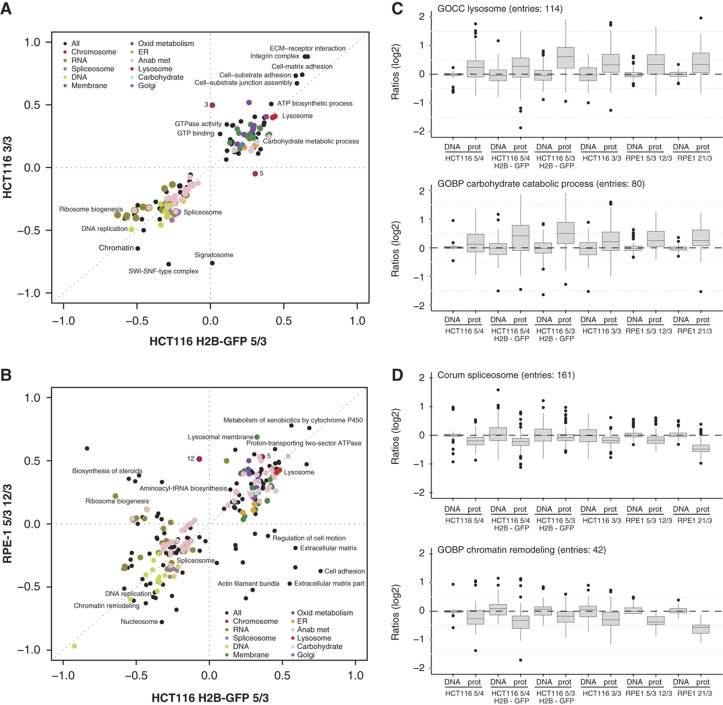
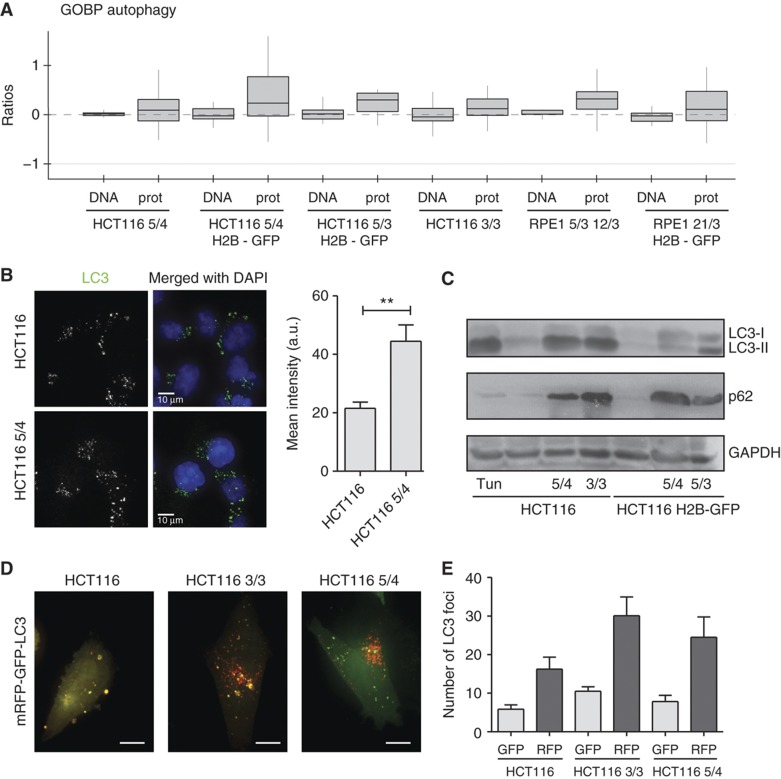
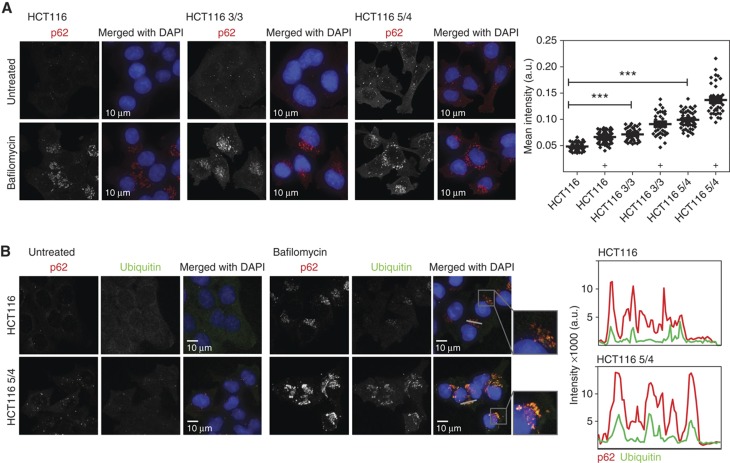
Extra chromosome copies markedly alter the physiology of eukaryotic cells, but the underlying reasons are not well understood. We created human trisomic and tetrasomic cell lines and determined the quantitative changes in their transcriptome and proteome in comparison with their diploid counterparts. We found that whereas transcription levels reflect the chromosome copy number changes, the abundance of some proteins, such as subunits of protein complexes and protein kinases, is reduced toward diploid levels. Furthermore, using the quantitative data we investigated the changes of cellular pathways in response to aneuploidy. This analysis revealed specific and uniform alterations in pathway regulation in cells with extra chromosomes. For example, the DNA and RNA metabolism pathways were downregulated, whereas several pathways such as energy metabolism, membrane metabolism and lysosomal pathways were upregulated. In particular, we found that the p62-dependent selective autophagy is activated in the human trisomic and tetrasomic cells. Our data present the first broad proteomic analysis of human cells with abnormal karyotypes and suggest a uniform cellular response to the presence of an extra chromosome.


Conflict of interest statement

The authors declare that they have no conflict of interest.

Figures

Figure 1
Figure 1
Characterization of HCT116 and its tri- and tetrasomic derivatives. (A) Chromosome paints of used tri- and tetrasomic cell lines. Bar—10 μm. (B) Growth curves of tri- and tetrasomic cell lines in comparison with their diploid counterparts. Each point represents the mean with standard deviation of three independent experiments. (C) Cell-cycle progression of HCT116 (left panel) and HCT116 5/4 (right panel) after release from thymidine block, analyzed by flow cytometry. The major delay occurs in the G1 and the S phase. The length of each cell-cycle phase is indicated above the graph. Population was considered to enter a specific phase of cell cycle if at least 50% of cells showed corresponding DNA content. See also Supplementary Figure S1. Source data is available for this figure in the Supplementary Information.
Figure 2
Figure 2
Quantification of DNA, mRNA and protein abundance. (A) Ratios (log2) of DNA, mRNA and protein abundance changes between HCT116 5/4 and HCT116 aligned with respect to their chromosome position. Each dot represents abundance changes for one gene, the corresponding mRNA and the corresponding protein, respectively. CGH analysis revealed some deleted regions in chromosome 5 (upper panel); the disomic entries were omitted in all analyses (threshold 0.65 [log2]). (B) Overlays of mRNA and protein density histograms (HCT116 5/4 versus HCT116). The full line represents median of protein abundance changes, the dashed line median of mRNA abundance changes. Values of respective medians are plotted in the graph. The difference between distribution of proteins and mRNAs coded on chromosome 5 is statistically significant (Wilcoxon rank sum test). See also Supplementary Figure S2.
Figure 3
Figure 3
Abundance of subunits of protein complexes and kinases in the tetrasomic cell line. (A) Density plots of subunits of protein complexes (as defined in the CORUM database) encoded on all disomic chromosomes compared with non-CORUM proteins (left panel); the same for proteins encoded on the tetrasomic chromosome 5 (right panel). The differences between CORUM and non-CORUM populations of chromosome 5 are statistically significant (Wilcoxon rank sum test). Dashed lines indicate medians of the populations. (B) Examples of protein complexes with at least one subunit coded on the tetrasomic chromosome 5. Each dot represents abundance changes of one gene (black), its corresponding mRNA (blue) and protein (red). Subunits coded on chromosome 5 are indicated with an arrow and number. (C) The abundance of DNA, mRNA and proteins of kinases coded on chromosome 5. See also Supplementary Figure S3. Source data is available for this figure in the Supplementary Information.
Figure 4
Figure 4
Uniform global response to presence of an extra chromosome. (A) Two-dimensional annotation enrichment analysis. Pathways altered in the cell line with chromosome 3 trisomy in comparison with the cell line with chromosome 5 trisomy are plotted (Benjamini-Hochberg FDR threshold 0.02). Each dot represents one category as defined in the KEGG and GO database, the colors mark groups of related pathways as described in the inset. Axis—position scores of the pathways; negative values indicate downregulation, positive values indicate upregulation. See Supplementary Information for further details. (B) Pathway alterations identified in HCT116 and RPE-1 cells show similar trends. (C, D) Box-plots of all proteins within representative categories identified as significantly altered by the two-dimensional annotation enrichment analysis. Examples of upregulated (lysosome, carbohydrate catabolic process) and downregulated (spliceosome, chromatin remodeling) pathways show uniform response among all cell lines with extra chromosomes. All differences between DNA and protein levels are statistically significant (unpaired T-test with Welch’s correction, P<0.05). For more information, see also Supplementary Figure S4 and Supplementary Table S2.
Figure 5
Figure 5
Activation of autophagy in trisomic and tetrasomic cell lines. (A) Abundance changes of the sub-category autophagy (GOBP) in all analyzed cell lines are depicted. CGH and proteome data are shown. (B) Fluorescence intensity of LC3-positive foci in HCT116 and HCT116 5/4. Right panel: quantification of the fluorescence intensity (non-parametric T-test, **P<0.01). (C) Western blot of LC3-II shows an increase in all analyzed aneuploids. Similarly, levels of p62/SQSTM1 are increased in aneuploids. Note that p62 is coded on chromosome 5, but its levels are increased in all aneuploids. Tun—diploid HCT116 treated with tunicamycin that activates unfolded protein response and hence autophagy. (D) Representative images of cells after transfection with the double-tagged mRFP-GFP-LC3. Yellow foci represent phagosomes (both GFP and mRFP signals visible), red foci represent lysosomes (only mRFP signal is insensitive to the acidic pH in lysosomes). Bar 10 μm. (E) Total number of LC3 foci within a defined area of each cell (2500 voxels). There are significantly more foci in the HCT116 3/3 cell line (non-parametric T-test, P<0.01), the levels in HCT116 5/4 are higher, but the difference from HCT116 is not statistically significant. See also Supplementary Figure S5. Source data is available for this figure in the Supplementary Information.
Figure 6
Figure 6
Analysis of autophagy in trisomic and tetrasomic cell lines. (A) Tri- and tetrasomic cells accumulate p62-positive foci. This effect was further increased by treatment with Bafilomycin A1. Right panel: Quantification of the fluorescence intensity changes; significance was evaluated by non-parametric T-test (***P<0.001), ‘+’ designates addition of Bafilomycin A1. (B) p62-positive foci co-localize with ubiquitin-positive foci and their fluorescence intensity is increased in aneuploid cell lines. Plots represent the signal intensity along the indicated gray line. Red line—p62, green line—ubiquitin. Source data is available for this figure in the Supplementary Information.

References

    1. Aït Yahya-Graison E, Aubert J, Dauphinot L, Rivals I, Prieur M, Golfier G, Rossier J, Personnaz L, Créau N, Bléhaut H, Robin S, Delabar JM, Potier MC (2007) Classification of human chromosome 21 gene-expression variations in Down syndrome: impact on disease phenotypes. Am J Hum Genet 81: 475–491 - PMC - PubMed
    1. Birchler JA, Riddle NC, Auger DL, Veitia RA (2005) Dosage balance in gene regulation: biological implications. Trends Genet 21: 219–226 - PubMed
    1. Chen G, Bradford WD, Seidel CW, Li R (2012) Hsp90 stress potentiates rapid cellular adaptation through induction of aneuploidy. Nature 482: 246–250 - PMC - PubMed
    1. Edgar R, Domrachev M, Lash AE (2002) Gene Expression Omnibus: NCBI gene expression and hybridization array data repository. Nucleic Acids Res 30: 207–210 - PMC - PubMed
    1. Fournier RE (1981) A general high-efficiency procedure for production of microcell hybrids. Proc Natl Acad Sci USA 78: 6349–6353 - PMC - PubMed

Publication types