. 2012:8:610.
doi: 10.1038/msb.2012.42.

Gene location and DNA density determine transcription factor distributions in Escherichia coli

Affiliations

Gene location and DNA density determine transcription factor distributions in Escherichia coli

Thomas E Kuhlman et al. Mol Syst Biol. 2012.

Abstract

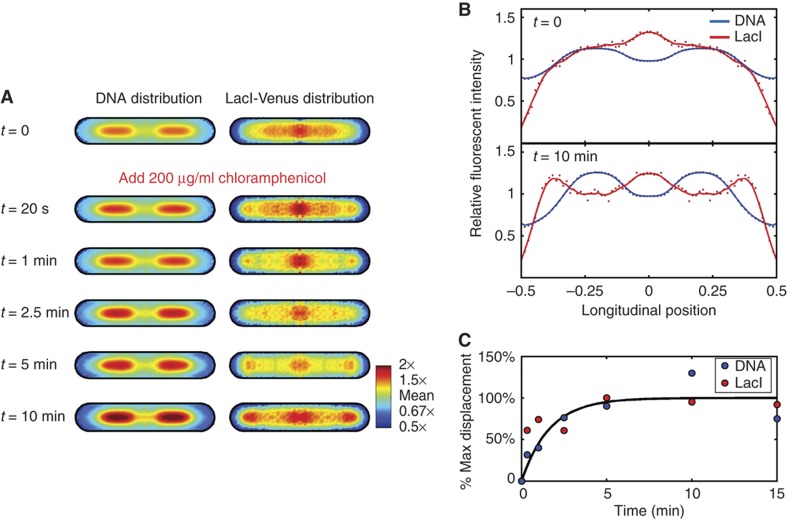
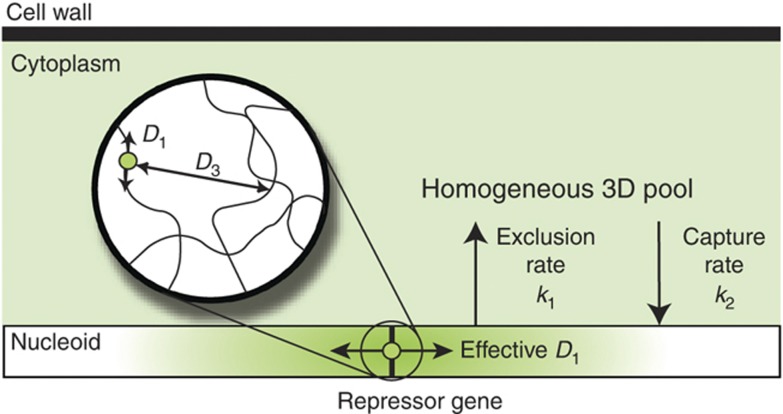
The diffusion coefficient of the transcription factor LacI within living Escherichia coli has been measured directly by in vivo tracking to be D = 0.4 μm(2)/s. At this rate, simple models of diffusion lead to the expectation that LacI and other proteins will rapidly homogenize throughout the cell. Here, we test this expectation of spatial homogeneity by single-molecule visualization of LacI molecules non-specifically bound to DNA in fixed cells. Contrary to expectation, we find that the distribution depends on the spatial location of its encoding gene. We demonstrate that the spatial distribution of LacI is also determined by the local state of DNA compaction, and that E. coli can dynamically redistribute proteins by modifying the state of its nucleoid. Finally, we show that LacI inhomogeneity increases the strength with which targets located proximally to the LacI gene are regulated. We propose a model for intranucleoid diffusion that can reconcile these results with previous measurements of LacI diffusion, and we discuss the implications of these findings for gene regulation in bacteria and eukaryotes.


Conflict of interest statement

The authors declare that they have no conflict of interest.

Figures

Figure 1
Figure 1
Image averaging procedure. (A) A representative image field with lacI-venus integrated near the origin (atpI locus) imaged at × 133 magnification. (B) Individual cells are found using an automated algorithm, and coordinates are established at the cellular centroid to measure cellular dimensions and the location of each pixel. (C) Because of the narrow distribution of cell widths, correctly identified cells are identified according to correspondence with the appropriate width and binned according to the ratio of the length to width. Alternating gray and white bars indicate each bin. (D) Cells within each bin are rescaled to the size of the average cell within that bin and averaged together on a per-pixel basis and over all orientations.
Figure 2
Figure 2
Average spatial distribution of lacI-venus expression. Cells were grown in M63 minimal medium+0.5% glycerol before fixation. Averages are for cells of 1.9–2.2 μm in length, the bin identified in Figure 1D. Averages are also taken over all cell orientations, resulting in the symmetry of each plot. Raw images of combined transmitted and fluorescence channels are shown in the first column for DNA ( × 400, DAPI staining; row 1), gene locus ( × 400, FROS; row 2), mRNA ( × 400, FISH; row 3), LacI-Venus protein ( × 400, TIRF microscopy, row 4), and LacI-Venus protein without DNA binding domain ( × 400, TIRF microscopy, row 5). Representative LacI-Venus images are at × 133magnification for visual clarity. Remaining columns show average distributions for each component with the lacI-venus source gene expressed from the indicated location. Fluorescent intensity is normalized to the mean fluorescence within the cell. The quantitative color scale is for LacI-Venus only; other averages are qualitatively scaled for comparison. The essQ locus was the LacI-Venus source for terminus, but the gene location shown is for the adjacent nth terminal locus for clarity (Kuhlman and Cox, 2010); essQ localization is identical but less clear due to reduced binding at that locus.
Figure 3
Figure 3
Average TF distributions as a function of growth state: one chromatid. Average DNA (first row) and LacI-Venus distributions with and without the DNA binding domain (subsequent groups of two rows, respectively) are shown as a function of lacI-venus gene integration location (rows) for stationary phase cells (left) and slow growing exponential phase cells containing one chromatid (right). Stationary phase results are from cells grown overnight in M63 minimal medium+0.5% glycerol. LacI-Venus distributions were obtained by excitation with a 488-nm wavelength laser except in the case of the midreplichore integrants, where a 514-nm laser was used for excitation to increase the signal-to-noise ratio. The DAPI channel is shown as green in the first row to improve sensitivity to the eye. Average DNA content for exponential growth is scaled to be directly comparable to Figures 4 and 5 (see Supplementary Figure 3C and D and Kubitschek, 1974). Distributions of gene location in the first column are from cells grown in M63+0.5% glycerol that are 1.9–2.2 μm in length; gene distributions in stationary phase remain similar and are compared directly in Supplementary Figure 5A.
Figure 4
Figure 4
Average TF distributions as a function of growth state: two chromatids. Average DNA (first row) and LacI-Venus distributions with and without the DNA binding domain (subsequent groups of two rows, respectively) are shown as a function of lacI-venus gene integration location (rows) for exponentially slow growing cells in M63+0.5% glycerol (left) and exponentially fast growing cells containing two chromatids (right). Fast growth in RDM+0.5% glucose yields a doubling time of 22±2 min. Stationary phase results are from cells grown overnight in M63 minimal medium+0.5% glycerol. LacI-Venus distributions of exponentially slow growing origin and terminus integrants we obtained by Venus excitation with a 488-nm wavelength laser; all other conditions were obtained with a 514-nm laser to increase the signal-to-noise ratio. Average DNA content in each case is scaled relative to slow growing cells containing one chromatid in Figure 4. Distributions of gene location shown in the first column are from growth in M63+0.5% glycerol that are 4.2–4.5 μm in length; gene distributions in exponential fast growth are similar and are compared directly in Supplementary Figure 5B.
Figure 5
Figure 5
LacI redistribution as a result of nuceloid condensation. (A) The steady-state distribution of DNA and LacI-Venus in cells with lacI-venus integrated near the origin (atpI locus) and grown in M63+0.5% glycerol, cell length of 4.2–4.5 μm, are shown at t=0. After this sample was taken, 200 μg/ml chloramphenicol was added directly to the culture and samples were withdrawn and fixed at the indicated times. Note that the color scale has been changed somewhat from Figure 4 to accommodate the condensed DNA. (B) Cross-sections along the longitudinal axis of the DNA (blue) and LacI-Venus (red) distributions at time t=0 (top) and t=10 min (bottom). Lines are a moving average of six adjacent points. (C) The rate of mass displacement. Displacement is quantified as the total difference between each distribution and the initial distribution at time t=0. The black line corresponds to a simultaneous fit of both data sets to the equation formula image. The equivalent result for LacI42-Venus is shown in Supplementary Figure 6. Source data is available for this figure in the Supplementary Information.
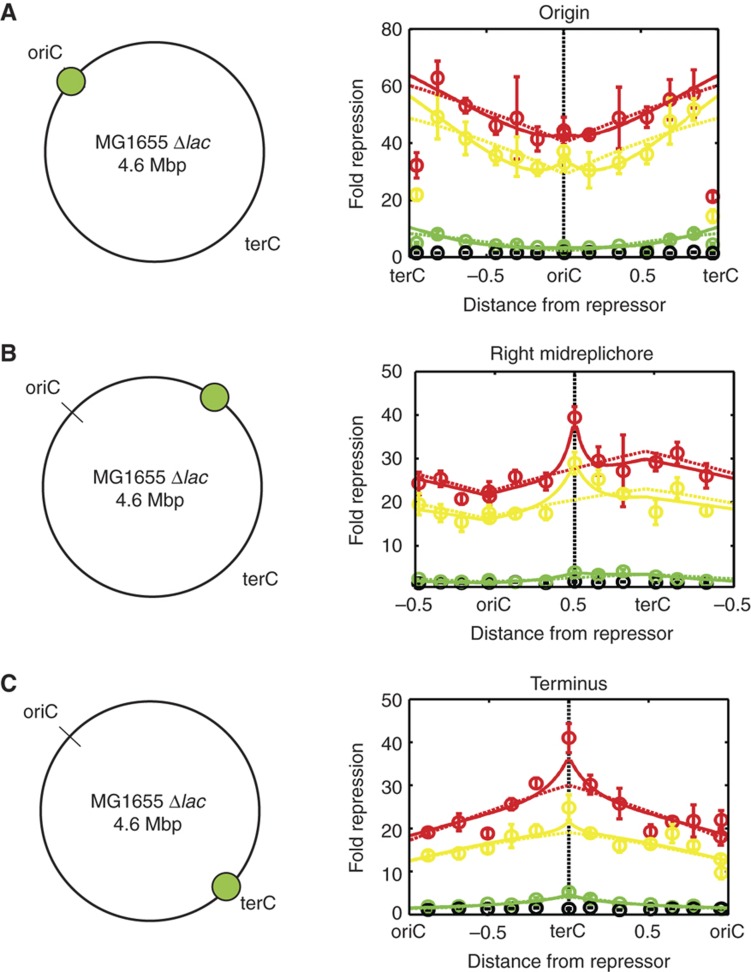
Figure 6
Figure 6
Repression strength as a function of intergenic distance. Repression strength as a function of genomic distance from the lacI-venus gene, where lacI-venus is near (A) origin (atpI locus), (B) mid-replichore (ybbD locus), or (C) terminus (nth locus). Red: slow growth (τ=110±12 min); yellow: medium growth (τ=68±5 min); green: fast growth (τ=22±2 min); black: M63+0.5% glycerol+2 mM IPTG control; circles are the mean of four measurements, error bars are the s.d. Dashed lines indicate best fits assuming spatially homogeneous distribution of repressor. Solid lines indicate best fits assuming exponential LacI-Venus inhomogeneity. Source data is available for this figure in the Supplementary Information.
Figure 7
Figure 7
A model of intranucleoid diffusion. TFs are produced at the site of the source gene within the nucleoid. TFs are initially confined to the nucleoid and diffuse via 1D sliding along the chromosome combined with short 3D hops between domains, which we coarse grain together as effective 1D diffusion along the entire nucleoid. TFs are excluded from the nucleoid with rate constant k1, where they quickly homogenize via rapid 3D diffusion to form a background pool of repressor. TFs can be recaptured into the nucleoid rate constant k2, and are diluted with rate constant β.

References

    1. Ahmed S, Brickner DG, Light WH, Cajigas I, McDonough M, Froyshteter AB, Volpe T, Brickner JH (2010) DNA zip codes control an ancient mechanism for gene targeting to the nuclear periphery. Nat Cell Biol 12: 111–118 - PMC - PubMed
    1. Ahmed S, Brickner JH (2007) Regulation and epigenetic control of transcription at the nuclear periphery. Trends Genet 23: 396–402 - PubMed
    1. Bates D, Kleckner N (2005) Chromosome and replisome dynamics in E. coli: loss of sister cohesion triggers global chromosome movement and mediates chromosome segregation. Cell 121: 899–911 - PMC - PubMed
    1. Berg OG, Winter RB, von Hippel PH (1981) Diffusion-driven mechanisms of protein translocation on nucleic acids. 1. Models and theory. Biochemistry 20: 6929–6948 - PubMed
    1. Berger M, Farcas A, Geertz M, Zhelyazkova P, Brix K, Travers A, Muskhelishvili G (2010) Coordination of genomic structure and transcription by the main bacterial nucleoid-associated protein HU. EMBO Rep 11: 59–64 - PMC - PubMed

Publication types

MeSH terms