. 2012 Nov 1;120(18):3718-28.
doi: 10.1182/blood-2012-05-428672. Epub 2012 Sep 11.

Regulating type 1 IFN effects in CD8 T cells during viral infections: changing STAT4 and STAT1 expression for function

Affiliations

Regulating type 1 IFN effects in CD8 T cells during viral infections: changing STAT4 and STAT1 expression for function

M Pilar Gil et al. Blood. .

Abstract

Type 1 IFNs can conditionally activate all of the signal transducers and activators of transcription molecules (STATs), including STAT4. The best-characterized signaling pathways use STAT1, however, and type 1 IFN inhibition of cell proliferation is STAT1 dependent. We report that type 1 IFNs can basally stimulate STAT1- and STAT4-dependent effects in CD8 T cells, but that CD8 T cells responding to infections of mice with lymphocytic choriomenigitis virus have elevated STAT4 and lower STAT1 expression with significant consequences for modifying the effects of type 1 IFN exposure. The phenotype was associated with preferential type 1 IFN activation of STAT4 compared with STAT1. Stimulation through the TCR induced elevated STAT4 expression, and STAT4 was required for peak expansion of antigen-specific CD8 T cells, low STAT1 levels, and resistance to type 1 IFN-mediated inhibition of proliferation. Thus, a mechanism is discovered for regulating the consequences of type 1 IFN exposure in CD8 T cells, with STAT4 acting as a key molecule in driving optimal antigen-specific responses and overcoming STAT1-dependent inhibition of proliferation.


Figures

Figure 1
Figure 1
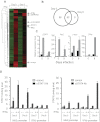
Type 1 IFN gene targets in CD8 T cells. CD8 T cells were purified from uninfected WT, STAT1-deficient, and STAT4-deficient mice and either control-treated or treated with 10 000 U/mL IFNα for 90 minutes. The RNA was then extracted and analyzed on Affymetrix Arrays, displaying 10 000 known genes, using dChip software for data mining (A-B). The hierarchical clustering algorithm used is based on the Pearson correlation coefficient. Red areas indicate high gene expression, and green areas indicate low expression (A). The cutoff for gene induction was considered 2.35, and the samples were compared by permuting them 50 times to assess the false discovery rate (B). Real-time PCR analysis of STAT1, OASl1, Mx2, c-myc, MAP3K8, and IFNγ mRNA was performed. Black bars show results with control-treated and gray bars show results with IFNα-treated CD8 T-cell samples (C). Where shown, bars represent SEMs. Results are based on accumulated data from 3 replicates.
Figure 2
Figure 2
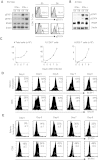
Type 1 IFN gene targets in CD8 T cells prepared on day 8 of LCMV infection. CD8 T cells were purified from uninfected (D0) or D8 LCMV-infected WT mice and treated with either control or IFNα for 90 minutes. The RNA was extracted and analyzed in comparison with D0 samples as in Figure 1A and B. Real-time PCR analysis of STAT1, Mx2, c-myc, and IFNγ mRNA was performed. Black bars show results with control-treated and gray bars show results with IFNα-treated CD8 T-cell samples (C). (D) CD8 T cells were treated with formaldehyde to crosslink DNA-bound transcription factors to DNA. STAT1 or STAT4 promoter binding was evaluated by chromatin immunoprecipitation and qPCR with custom primers (see “Chromatin immunoprecipitation” and “Real-time PCR”). Where shown, bars represent SEMs. Results are based on accumulated data from 3 or more replicates.
Figure 3
Figure 3
STAT1 and STAT4 responsiveness to type 1 IFN in CD8 T cells during infection. WT mice were uninfected (D0) or infected with LCMV for 8 days (D8). CD8 T cells were purified for Western blot analysis or identified in mixed populations by flow cytometric analyses. Cells were examined after control or IFNα treatments for 90 minutes ex vivo (A) or in vivo (B). The results of ex vivo treatments are shown in panel A. Western blot analyses of pSTAT1, pSTAT4, IFNAR, or β-actin proteins extracted from purified CD8 T cells are presented. Flow cytometric analyses of pSTAT1 or pSTAT4 in CD8 T-cell subsets of mixed populations are to the right. Solid dark lines show staining of IFNα-treated cells. Gray areas show staining of untreated cells, and dotted lines show staining with isotype controls for cytokine-treated samples. (B) The results using purified CD8 T cells isolated from mice treated with either control or IFNα for Western blot analysis of pSTAT1, pSTAT4, IFNAR, and β-actin proteins are shown. Results are representative of 2 or more independent experiments, with percentages in flow panels showing means ± SEMs of 3 independent samples analyzed within 1 experiment. To analyze STAT1 and STAT4 levels in CD8 T cells responding to LCMV infection, cells were prepared from uninfected mice or mice infected with LCMV for the indicated times. Total spleen yields were measured, and the percentages and numbers of CD8 T cells was determined with flow cytometry (C). (D) Cytoplasmic staining of total STAT1 was evaluated in total cells and in CD8 T-cell subsets. (E) Cytoplasmic staining of total STAT4 was determined in total cells and in CD8 T-cell subsets. Numbers given are positive averages, with isotype control staining subtracted, and SEMs. Arrows identify peak STAT intensities in CD8 T-cell subsets (D-E). Results are representative of 2 or more independent experiments, with percentages in flow panels that show means ± SEMs of 3 independent samples analyzed within 1 experiment.
Figure 4
Figure 4
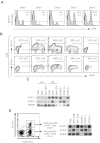
STAT1 and STAT4 levels in proliferating CD8 T cells responding to LCMV infection. Cells were prepared from uninfected mice or mice infected with LCMV for the indicated times. The percentages of CD8 T cells were determined with flow cytometry to stain the subsets (A). To identify the proliferating subsets, BrdU was administered in vivo 2 hours before harvest, and CD8 T-cell subsets were examined for expression of STAT1 or STAT4 along with BrdU (B). Numbers given are positive averages ± SEMs, with isotype control staining subtracted, of 3 independent sample analyzed within 1 experiment. Results are representative of 2 or more independent experiments. Arrows mark areas of peak BrdU incorporation. The consequences of LCMV infection for STAT expression in CD8 T cells subsets from WT mice were evaluated by Western blot analysis. Studies were performed with WT mice either uninfected (D0) or infected with LCMV for 8 days (D8). (C) STAT1 and STAT4 expression levels were determined on D0 or D8 by Western blot analysis with the use of total, CD8, and non-CD8 cell preparations. Cell lysates were made and analyzed as indicated in “Western blot analysis.” Samples were tested for STAT1, STAT4, and IFNAR levels. The specificity was confirmed with samples from IFNAR, STAT1, and STAT4 mice as controls. Results are representative of 2 or more independent experiments with 3 animals individually tested. (D) The LCMV-specific CD8 T cells were separated from total and nonspecific CD8 T cells on D8 of infection according to staining with pooled class 1 tetramers presenting the 3 immunodominant LCMV peptides for the B6 mice, NP396-404, GP267-286, and GP33-41 (Tet+ or Tet). The total and sorted CD8 T-cell populations were analyzed for STAT1, STAT4, and IFNAR expression as described earlier. Results are representative of 2 or more independent experiments.
Figure 5
Figure 5
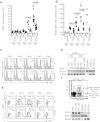
Role for endogenous STAT4 in the magnitude of CD8 T-cell expansion and proliferation. Responses in STAT4-deficient mice were compared with those in WT mice at different times after LCMV infection. (A) Total CD8 T-cell numbers and (B) BrdU incorporating CD8 T-cell numbers were measured in WT and STAT4-deficient mice that were uninfected (D0) or infected with LCMV for the indicated times. Individual symbols represent results from individual mice. Individual symbols show results from 2 to 8 mice collected from multiple experiments. Bars represent means. STAT4 effects on CD8 T-cell proliferation and STAT1 induction within total and antigen-specific subsets were evaluated. Responses in STAT4-deficient mice were compared with those in WT mice (C). The percentages of CD8 T cells were determined with flow cytometry to stain the subsets. (D) STAT1 and STAT4 expression levels were determined on D0 or D8 by Western blot analysis with the use of total, CD8, and non-CD8 cell preparations isolated from STAT4-deficient mice. Cell lysates were made and analyzed as indicated in Figure 4. Results are representative of 2 or more independent experiments with 3 animals individually tested. (E) To identify the proliferating populations, BrdU was administered in vivo, 2 hours before harvest as per samples in panel A, and CD8 T-cell subsets were examined for expression of STAT1 along with BrdU with the use of flow cytometry. Results are representative of 2 or more independent experiments, with percentages in flow panels showing means ± SEMs of 3 independent samples analyzed within 1 experiment. (F) The LCMV-specific CD8 T cells were separated from total and nonspecific CD8 T cells, on D8 of infection of STAT4-deficient mice, based on staining with pooled class 1 tetramers presenting the 3 immunodominant LCMV peptides for the B6 mice, NP396-404, GP267-286, and GP33-41. The total and sorted CD8 T-cell populations were analyzed for STAT1, STAT4, and IFNAR expression as described in Figure 4. Results are representative of 2 or more independent experiments.
Figure 6
Figure 6
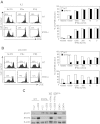
Role for STAT4 in cytokine- or antigen receptor-driven CD8 T-cell proliferation. The intrinsic proliferative responsiveness of WT and STAT4-deficient CD8 T cells were examined ex vivo by stimulation with IL-2 or anti-CD3. Highly purified CD8 T cells were labeled with CFSE and cultured for 5 days with IL-2 (A) or anti-CD3 (B). Proliferation was evaluated by dilution of the dye. Numbers given in histograms represent percentages. Sensitivity to type 1 IFN-mediated inhibition was evaluated by titrating in the indicated concentrations of IFNα or IFNβ in the presence of IL-2 (A) or anti-CD3 (B). The bar graphs show proportions under the different conditions. The highest dose of IFNα was not tested. The results are representative of 2 or more independent experiments. (C) The effects of stimulation on STAT4 expression and the consequences for STAT1 induction were evaluated with CD8 T cells purified from WT and STAT4-deficient mice. The cells were cultured for 2 days with IL-2 or anti-CD3 with or without the addition of 10 000 U of IFNα. The proteins were then extracted. Western blot analyses of STAT4, STAT1, and β-actin were performed as indicated in “Western blot analysis.” The results are representative of 3 independent experiments.

Similar articles

Cited by

References

    1. Biron CA. Interferons alpha and beta as immune regulators–a new look. Immunity. 2001;14(6):661–664. - PubMed
    1. Brierley MM, Fish EN. Review: IFN-alpha/beta receptor interactions to biologic outcomes: understanding the circuitry. J Interferon Cytokine Res. 2002;22(8):835–845. - PubMed
    1. García-Sastre A, Biron CA. Type 1 interferons and the virus-host relationship: a lesson in detente. Science. 2006;312(5775):879–882. - PubMed
    1. O'Shea JJ, Murray PJ. Cytokine signaling modules in inflammatory responses. Immunity. 2008;28(4):477–487. - PMC - PubMed
    1. Platanias LC. Mechanisms of type-I- and type-II-interferon-mediated signalling. Nat Rev Immunol. 2005;5(5):375–386. - PubMed

Publication types

MeSH terms