. 2012 Nov 1;44(21):1027-41.
doi: 10.1152/physiolgenomics.00011.2012. Epub 2012 Sep 11.

Microarray and proteomic analysis of the cardioprotective effects of cold blood cardioplegia in the mature and aged male and female

Affiliations

Microarray and proteomic analysis of the cardioprotective effects of cold blood cardioplegia in the mature and aged male and female

Kendra M Black et al. Physiol Genomics. .

Abstract

Recently we have shown that the cardioprotection afforded by cardioplegia is modulated by age and gender and is significantly decreased in the aged female. In this report we use microarray and proteomic analyses to identify transcriptomic and proteomic alterations affecting cardioprotection using cold blood cardioplegia in the mature and aged male and female heart. Mature and aged male and female New Zealand White rabbits were used for in situ blood perfused cardiopulmonary bypass. Control hearts received 30 min sham ischemia and 120 min sham reperfusion. Global ischemia (GI) hearts received 30 min of GI achieved by cross-clamping of the aorta. Cardioplegia (CP) hearts received cold blood cardioplegia prior to GI. Following 30 min of GI the hearts were reperfused for 120 min and then used for RNA and protein isolation. Microarray and proteomic analyses were performed. Functional enrichment analysis showed that mitochondrial dysfunction, oxidative phosphorylation and calcium signaling pathways were significantly enriched in all experimental groups. Glycolysis/gluconeogenesis and the pentose phosphate pathway were significantly changed in the aged male only (P < 0.05), while glyoxylate/dicarboxylate metabolism was significant in the aged female only (P < 0.05). Our data show that specific pathways associated with the mitochondrion modulate cardioprotection with CP in the aged and specifically in the aged female. The alteration of these pathways significantly contributes to decreased myocardial functional recovery and myonecrosis following ischemia and may be modulated to allow for enhanced cardioprotection in the aged and specifically in the aged female.


Figures

Fig. 1.
Fig. 1.
Experimental protocol. Rabbits were sedated and subjected to cardiopulmonary bypass consisting of 30 min equilibrium, 30 min global ischemia (GI), and 120 min reperfusion. Control hearts were sham-manipulated and received no ischemia or cardioplegia (CP). GI hearts received 30 min of GI achieved by cross-clamping of the aorta. CP hearts received cold blood CP administered antegrade through the aortic root to induce cardiac arrest prior to ischemia. Following 30 min of GI the aortic cross-clamp was released, cardiopulmonary bypass was ceased, and the hearts were reperfused for 120 min. The heart was excised and placed in an ice-cold bath of Krebs-Ringer solution and was then subjected to a brief Langendorff retrograde perfusion to remove all blood, a possible source of contamination. The hearts were then either used immediately for measurement of infarct size or quick frozen in liquid nitrogen and used for RNA and protein isolation. Experimental groups are found at left, and time in minutes is found at bottom.
Fig. 2.
Fig. 2.
Experimental flow chart. Flow chart of transcriptomic and proteomic analysis. Transcriptomic and proteomic analyses were performed on matched samples.
Fig. 3.
Fig. 3.
Segmental shortening. Segmental shortening (SS) was calculated as [(end diastolic regional length − end systolic regional length) / end diastolic regional length] × 100%. There was no significant difference in the control groups between equilibrium and reperfusion. SS was significantly decreased in GI with reperfusion (P < 0.05 vs. control) in all experimental groups. CP significantly enhanced SS in the mature male, mature female, and aged male with reperfusion (NS vs. control; P < 0.05 vs. GI). However, in the aged female SS was significantly decreased with reperfusion compared with control (P < 0.05 vs. control) and significantly decreased with reperfusion compared with the aged male (P < 0.05 vs. aged male). NS, not significant. *P < 0.05 vs. equilibrium, **P < 0.05 vs. aged male.
Fig. 4.
Fig. 4.
Myocardial infarct size [% left ventricular (LV) mass]. Infarct size was determined using 1% TTC and expressed as a percentage of LV mass for each heart. There was no significant difference in the control groups. Infarct size was significantly increased (P < 0.05 vs. control) in GI and was significantly increased in aged compared with mature hearts (P < 0.05). CP significantly decreased infarct size (P < 0.05 vs. GI). There was no significant difference in infarct size between control and mature male or female with CP. However, infarct size in the aged hearts was significantly increased (P < 0.05 vs. control and CP mature). Infarct size was significantly increased in aged female with CP compared with aged male with CP (P < 0.05). *P < 0.05 vs. Equilibrium.
Fig. 5.
Fig. 5.
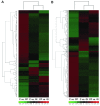
Differentially expressed genes in mature (A) and aged (B) females. The differentially expressed genes were identified by supervised analysis on the basis of P value <0.01 in each group; GI and CP groups were compared with control to account for constitutively expressed RNAs and CP vs. GI to show RNAs up- and downregulated in CP compared with GI. The log fold change (lFC) in gene expression is shown with pseudocolor scale (−3 to 3) with red denoting upregulation and green denoting downregulation. The columns represent lFC from comparisons and the rows represent the genes. Dendograms are shown on the left. Color scale is shown on the bottom.
Fig. 6.
Fig. 6.
Quality control analysis. A–C: mature male. D–F, mature female. G–I: aged male. J–L: aged female. Box plot analysis (A, D, G, J) showed alignment of average iTRAQ intensity values for all experimental groups in all experimental treatments. Principal component analysis (PCA) (B, E, H, K) indicated that in the mature male (B), mature female (E), and aged male (H) the proteins expressed in control (CTR), GI, and CP were separate and diverse for individual treatments, suggesting that the proteins had different expression levels. In contrast, in the aged female (K) the proteins expressed in GI and CP were clustered together, suggesting there was no difference between treatments. PC1, Principal Component 1, found on the x-axis, accounts for as much variability in the data as possible. PC2, Principal Component 2, found on the y-axis, accounts for as much variability as possible that is not related to PC1. CTR circled in green, GI circled in red, CP circled in orange. Pair-wise correlation plots (C, F, I, L) indicated highly significant differences in expressed proteins in the mature male (C), mature female (F), and aged male (I); whereas in the aged female (L) the r values for GI and CP were found to be insignificant, showing no difference between treatments.
Fig. 7.
Fig. 7.
Venn diagrams of all experimental groups: mature male, mature female, aged male, and aged female. A: all proteins. A total of 362 high confidence proteins were identified in all groups and treatments; 132 proteins were commonly identified in all experimental groups. B: GI. A total of 64 proteins were identified in GI. No proteins were commonly detected by mass spectrometry in all experimental groups. C: CP. A total of 84 proteins were identified in CP. Four proteins were commonly detected in all experimental groups.
Fig. 8.
Fig. 8.
Hierarchical cluster analysis of differentially expressed proteins. A: mature male. B: mature female. C: aged male. D: aged female. The differentially expressed proteins were identified by supervised analysis on the basis of P value <0.01 in each group: CTR, GI, CP. The proteins are identified with short descriptions obtained from the SWISS-PROT database. The lFC in protein expression is shown with pseudocolor scale (−3 to 3) with red denoting upregulation and green denoting downregulation. The columns represent lFC comparisons and the rows represent the proteins. Dendograms are found on the left, experimental groups are found on the bottom, and protein names are found on the right.
Fig. 9.
Fig. 9.
Western blot results for isocitrate dehydrogenase 2 (IDH2). A: validation of proteomic results via Western blot (WB) analysis. Results displayed as fold changes compared with control. B: image of immunoblot, performed using mouse monoclonal IDH2 antibody (1:2,000 dilution, Abcam). Blots were detected using ECL-Plus (Amersham Pharmacia Biotech) with species-appropriate secondary antibodies. Densitometry analysis was performed using the Image J analysis software. Lanes: 1, control; 2, mature male; 3, mature female; 4, aged male; 5, aged female.
Fig. 10.
Fig. 10.
Functional enrichment pathways for mature male (A), mature female (B), aged male (C), and aged female (D) GI vs. CTL. Functional enrichment analysis was performed by identifying the overrepresented gene ontology (GO) categories in differentially expressed proteins: this was done using the biological processes and molecular functions enrichment analysis available from the Database for Annotation, Visualization and Integrated Discovery (DAVID). Functional pathways are labeled on the x-axis, and the −log(P value) is on the y-axis. On the right is the ratio of proteins in pathway over total proteins, and the yellow line shows the ratio of each pathway. The red line is the threshold at P = 0.05. Any pathway that passes the red line is significantly enriched.
Fig. 11.
Fig. 11.
Functional enrichment pathways for mature male (A), mature female (B), aged male (C), and aged female (D) CP vs. CTL. Functional enrichment analysis was performed by identifying the overrepresented GO categories in differentially expressed proteins: this was done using the biological processes and molecular functions enrichment analysis available from the DAVID. Functional pathways are labeled on the x-axis, and the −log(P value) is on the y-axis. On the right is the ratio of proteins in pathway over total proteins, and the yellow line shows the ratio of each pathway. The red line is the threshold at P = 0.05. Any pathway that passes the red line is significantly enriched.
Fig. 12.
Fig. 12.
Age and sex modulation of the cardioprotective effects afforded by CP. The mitochondrion plays an important role in the modulation of the cardioprotective effects afforded by CP. Common pathways for mature and aged male and female are shown in the representative mitochondria. Relative contribution in each age group is shown by line number and width. [Ca2+]i, intracellular calcium concentration.

Similar articles

Cited by

References

    1. Abramov D, Tamariz MG, Sever JY, Christakis GT, Bhatnagar G, Heenan AL, Goldman BS, Fremes SE. The influence of gender on the outcome of coronary artery bypass surgery. Annal Thorac Surg 70: 800– 806, 2000. - PubMed
    1. Ahluwalia A, Narula J, Jones MK, Deng X, Tarnawski AS. Impaired angiogenesis in aging myocardial microvascular endothelial cells is associated with reduced importin alpha and decreased nuclear transport of HIF1 alpha: mechanistic implications. J Physiol Pharmacol 61: 133– 139, 2010. - PubMed
    1. Blankstein R, Ward RP, Arnsdorf M, Jones B, Lou YB, Pine M. Female gender is an independent predictor of operative mortality after coronary artery bypass graft surgery: contemporary analysis of 31 Midwestern hospitals. Circulation 112, Suppl: I323–I327, 2005. - PubMed
    1. Bolooki H, Green R, Vargas A, Kaiser GA, Ghahramani A. Coronary artery surgery in women. Tex Heart Inst J 31: 410– 417, 2004. - PMC - PubMed
    1. Cano KE, Li L, Bhatia S, Bhatia R, Forman SJ, Chen Y. NMR-based metabolomic analysis of the molecular pathogenesis of therapy-related myelodysplasia/acute myeloid leukemia. J Proteome Res 10: 2873– 2881, 2011. - PMC - PubMed

Publication types

Substances