

Evidence of an inhibitory restraint of seizure activity in humans
- PMID: 22968706
- PMCID: PMC3658011
- DOI: 10.1038/ncomms2056
Evidence of an inhibitory restraint of seizure activity in humans
Abstract
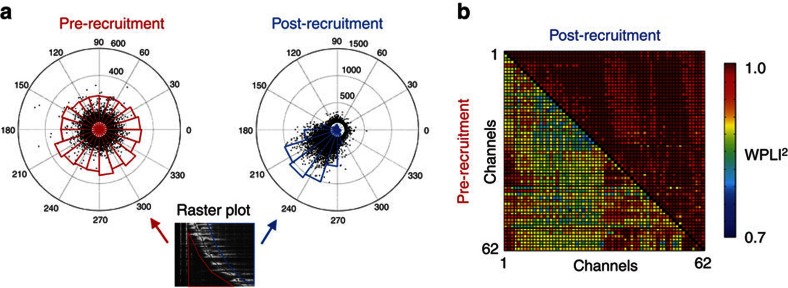
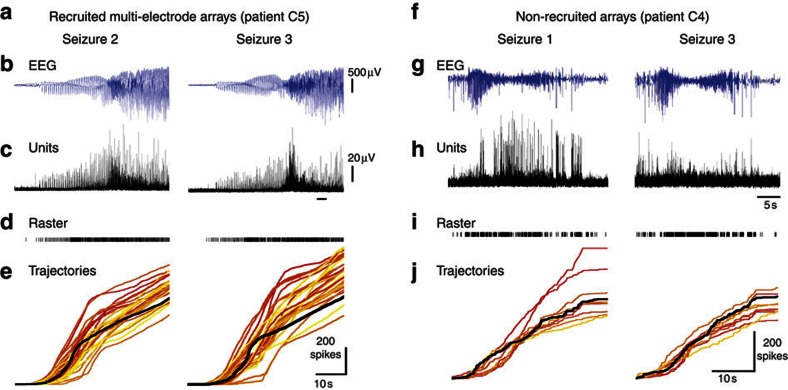
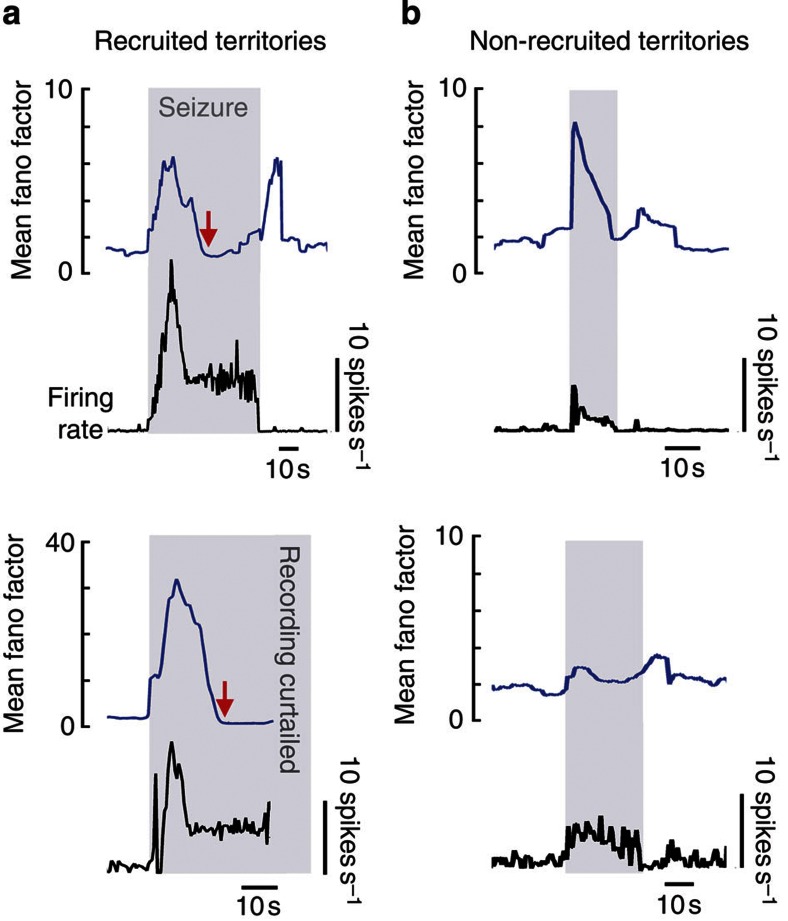
The location and trajectory of seizure activity is of great importance, yet our ability to map such activity remains primitive. Recently, the development of multi-electrode arrays for use in humans has provided new levels of temporal and spatial resolution for recording seizures. Here, we show that there is a sharp delineation between areas showing intense, hypersynchronous firing indicative of recruitment to the seizure, and adjacent territories where there is only low-level, unstructured firing. Thus, there is a core territory of recruited neurons and a surrounding 'ictal penumbra'. The defining feature of the 'ictal penumbra' is the contrast between the large amplitude EEG signals and the low-level firing there. Our human recordings bear striking similarities with animal studies of an inhibitory restraint, indicating that they can be readily understood in terms of this mechanism. These findings have important implications for how we localize seizure activity and map its spread.
Figures
 0.001, n=165).
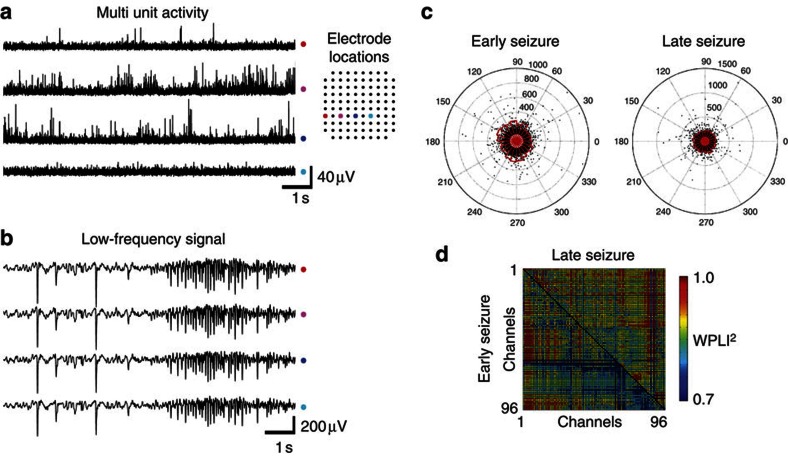
Comment in
-
Putting on the brakes: evidence for seizure inhibition and resistance in human microelectrode recordings.Neurosurgery. 2013 Jun;72(6):N13-4. doi: 10.1227/01.neu.0000430733.32997.38. Neurosurgery. 2013. PMID: 23685509 No abstract available.
References
-
- Matsumoto H. & Marsan C. A. Cortical cellular phenomena in experimental epilepsy: ictal manifestations. Exp. Neurol. 9, 305–326 (1964). - PubMed
-
- de Curtis M. & Avanzini G. Interictal spikes in focal epileptogenesis. Prog. Neurobiol. 63, 541–567 (2001). - PubMed
-
- McCormick D. A. & Contreras D. On the cellular and network bases of epileptic seizures. Annu. Rev. Physiol. 63, 815–846 (2001). - PubMed
-
- Steriade M., Amzica F., Neckelmann D. & Timofeev I. Spike-wave complexes and fast components of cortically generated seizures. II. Extra- and intracellular patterns. J. Neurophysiol. 80, 1456–1479 (1998). - PubMed
-
- Steriade M., Contreras D. & Amzica F. Synchronized sleep oscillations and their paroxysmal developments. Trends. Neurosci. 17, 199–208 (1994). - PubMed
Publication types
MeSH terms
Grants and funding
LinkOut - more resources
Full Text Sources
Other Literature Sources
Medical
