

Spending differences associated with the Medicare Physician Group Practice Demonstration
- PMID: 22968890
- PMCID: PMC3484377
- DOI: 10.1001/2012.jama.10812
Spending differences associated with the Medicare Physician Group Practice Demonstration
Abstract
Context: The Centers for Medicare & Medicaid Services (CMS) recently launched accountable care organization (ACO) programs designed to improve quality and slow cost growth. The ACOs resemble an earlier pilot, the Medicare Physician Group Practice Demonstration (PGPD), in which participating physician groups received bonus payments if they achieved lower cost growth than local controls and met quality targets. Although evidence indicates the PGPD improved quality, uncertainty remains about its effect on costs.
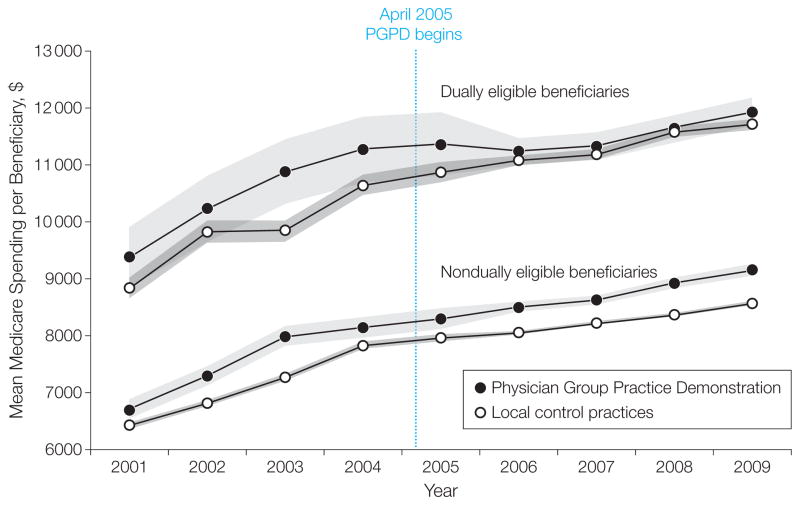
Objective: To estimate cost savings associated with the PGPD overall and for beneficiaries dually eligible for Medicare and Medicaid.
Design: Quasi-experimental analyses comparing preintervention (2001-2004) and postintervention (2005-2009) trends in spending of PGPD participants to local control groups. We compared estimates using several alternative approaches to adjust for case mix.
Setting: Ten physician groups from across the United States.
Patients and participants: The intervention group was composed of fee-for-service Medicare beneficiaries (n = 990,177) receiving care primarily from the physicians in the participating medical groups. Controls were Medicare beneficiaries (n = 7,514,453) from the same regions who received care largely from non-PGPD physicians. Overall, 15% of beneficiaries were dually eligible for Medicare and Medicaid.
Main outcome measure: Annual spending per Medicare fee-for-service beneficiary.
Results: Annual savings per beneficiary were modest overall (adjusted mean $114, 95% CI, $12-$216). Annual savings were significant in dually eligible beneficiaries (adjusted mean $532, 95% CI, $277-$786), but were not significant among nondually eligible beneficiaries (adjusted mean $59, 95% CI, $166 in savings to $47 in additional spending). The adjusted mean spending reductions were concentrated in acute care (overall, $118, 95% CI, $65-$170; dually eligible: $381, 95% CI, $247-$515; nondually eligible: $85, 95% CI, $32-$138). There was significant variation in savings across practice groups, ranging from an overall mean per-capita annual saving of $866 (95% CI, $815-$918) to an increase in expenditures of $749 (95% CI, $698-$799). Thirty-day medical readmissions decreased overall (-0.67%, 95% CI, -1.11% to -0.23%) and in the dually eligible (-1.07%, 95% CI, -1.73% to -0.41%), while surgical readmissions decreased only for the dually eligible (-2.21%, 95% CI, -3.07% to -1.34%). Estimates were sensitive to the risk-adjustment method.
Conclusions: Substantial PGPD savings achieved by some participating institutions were offset by a lack of saving at other participating institutions. Most of the savings were concentrated among dually eligible beneficiaries.
Conflict of interest statement
Figures
Comment in
-
ACOs--promise, not panacea.JAMA. 2012 Sep 12;308(10):1038-9. doi: 10.1001/2012.jama.11486. JAMA. 2012. PMID: 22968894 No abstract available.
-
Savings from the Medicare Physician Group Practice Demonstration.JAMA. 2013 Jan 2;309(1):30-1. doi: 10.1001/jama.2012.88176. JAMA. 2013. PMID: 23280215 No abstract available.
-
Savings from the Medicare Physician Group Practice Demonstration--reply.JAMA. 2013 Jan 2;309(1):31. doi: 10.1001/jama.2012.88179. JAMA. 2013. PMID: 23280216 No abstract available.
References
-
- Centers for Medicare & Medicaid Services. [Accessed August 14, 2012];Pioneer accountable care organization model: general fact sheet. http://innovations.cms.gov/Files/fact-sheet/Pioneer-ACO-General-Fact-She....
-
- Berwick DM. Making good on ACOs’ promise—the final rule for the Medicare shared savings program. N Engl J Med. 2011;365(19):1753–1756. - PubMed
-
- Congressional Budget Office. [Accessed May 11, 2012];Budget options. 2008 Dec;1 health care. http://www.cbo.gov/sites/default/files/cbofiles/ftpdocs/99xx/doc9925/12-....
-
- Trisolini M, Kautter J, Pope GC, Bapat B, Olmsted E, Urato M. [Accessed August 14, 2012];Physician Group Practice Demonstration quality measurment and reporting specifications. 2005 Jul 29; http://www.cms.gov/Medicare/Demonstration-Projects/DemoProjectsEvalRpts/....
Publication types
MeSH terms
Grants and funding
LinkOut - more resources
Full Text Sources
Medical
Miscellaneous
