. 2012 Dec;13(6):771-83.
doi: 10.1007/s10162-012-0347-y. Epub 2012 Sep 12.

Perilymph pharmacokinetics of markers and dexamethasone applied and sampled at the lateral semi-circular canal

Affiliations

Perilymph pharmacokinetics of markers and dexamethasone applied and sampled at the lateral semi-circular canal

Alec N Salt et al. J Assoc Res Otolaryngol. 2012 Dec.

Abstract

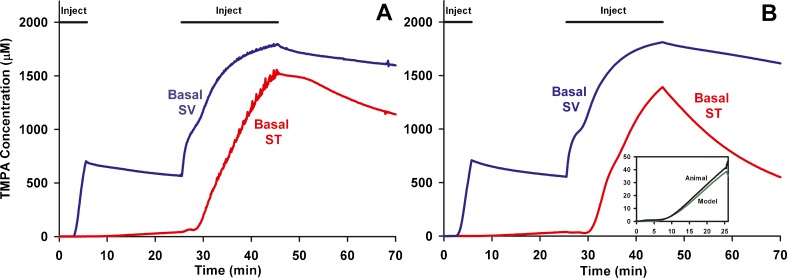
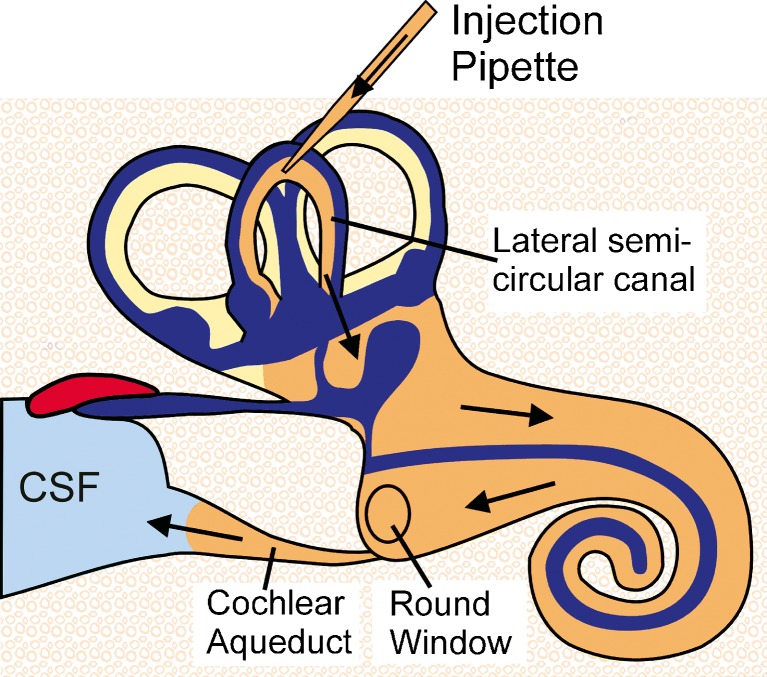
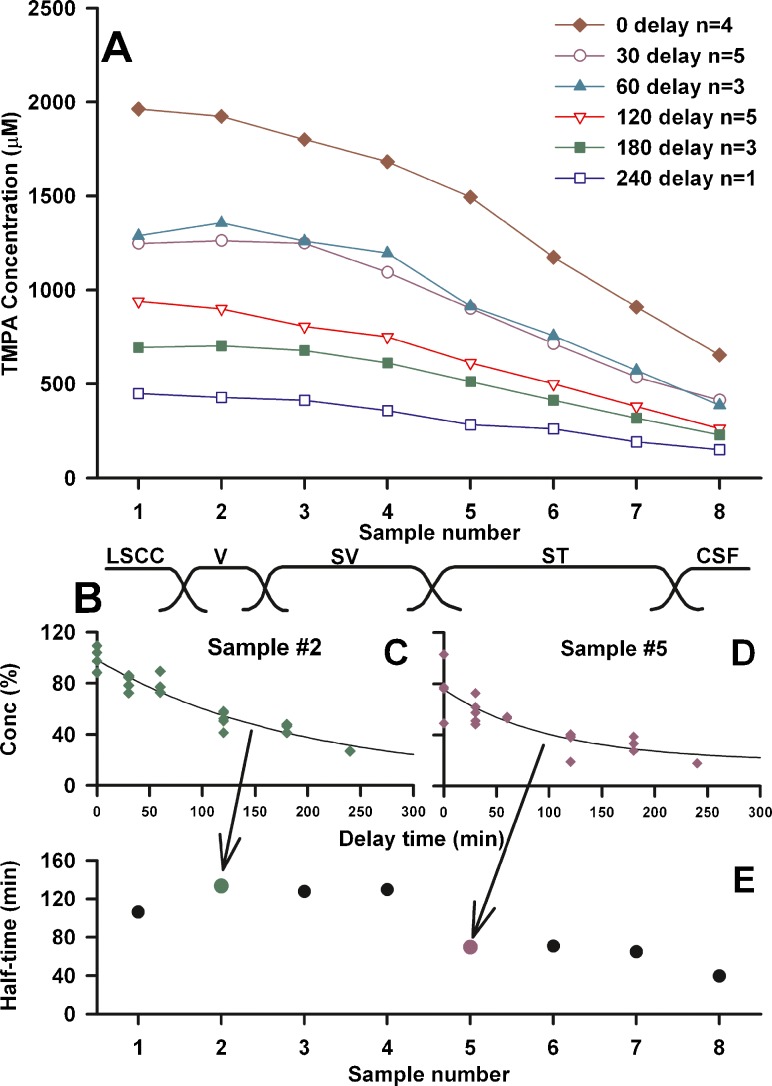
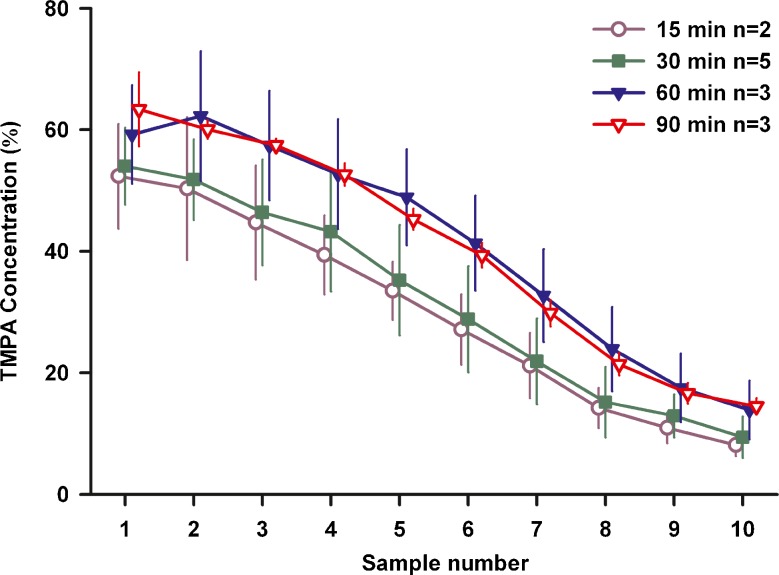
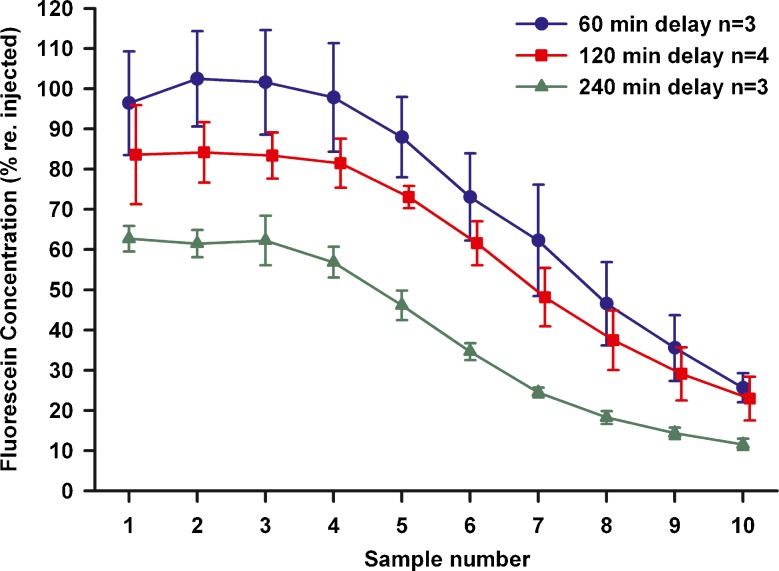
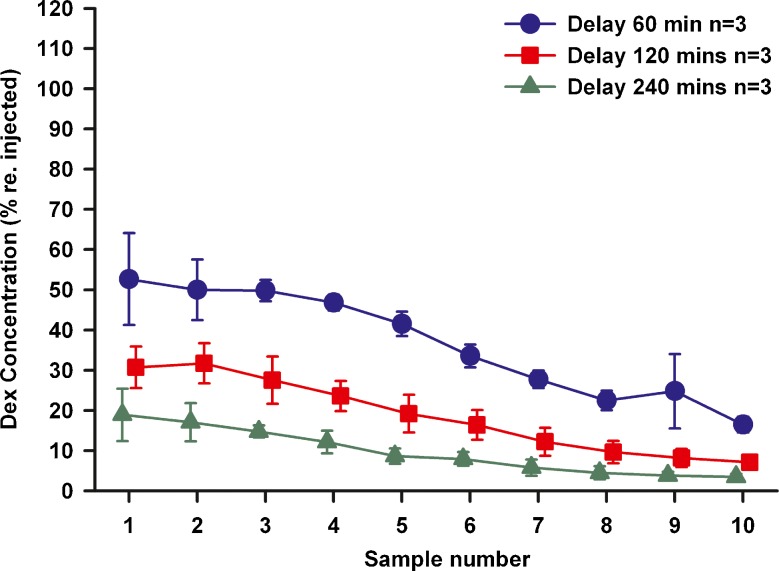
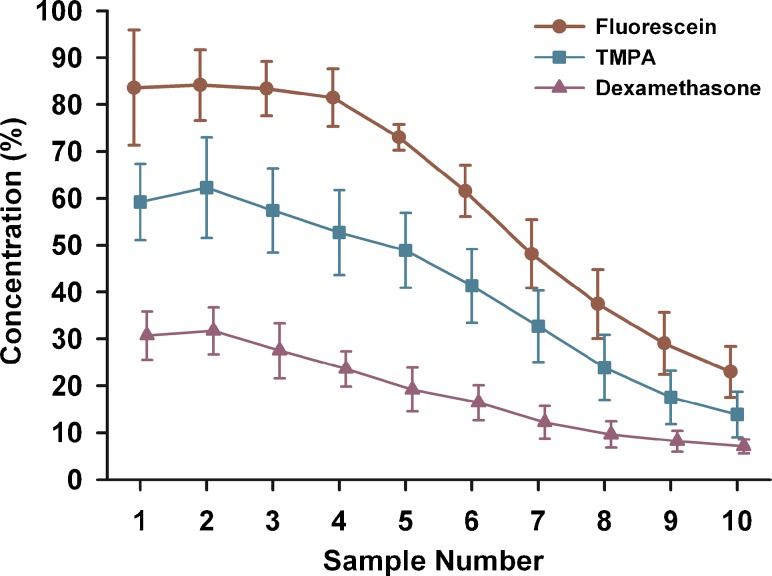
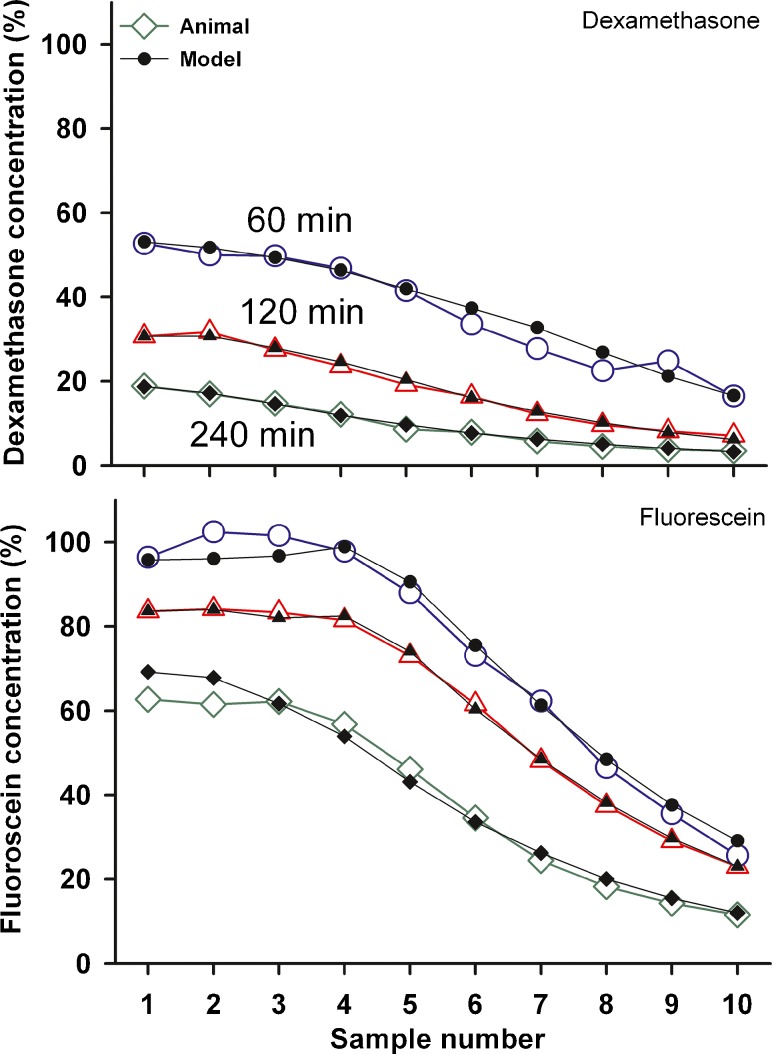
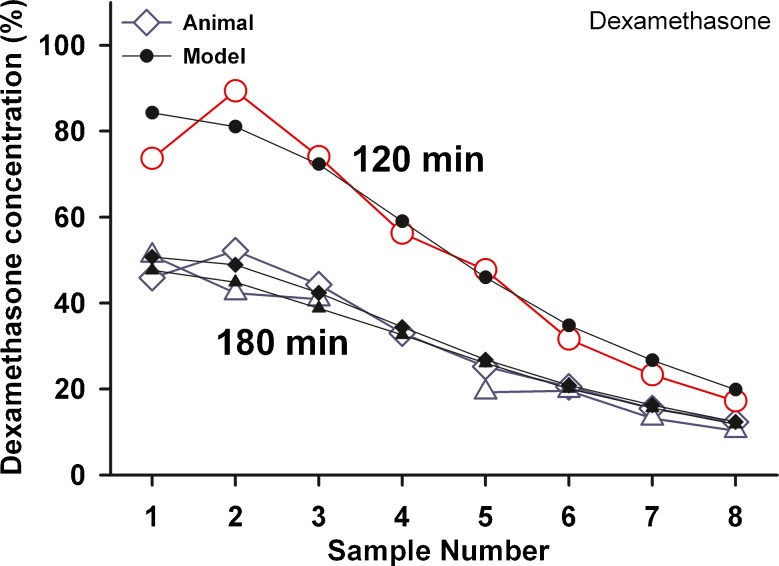
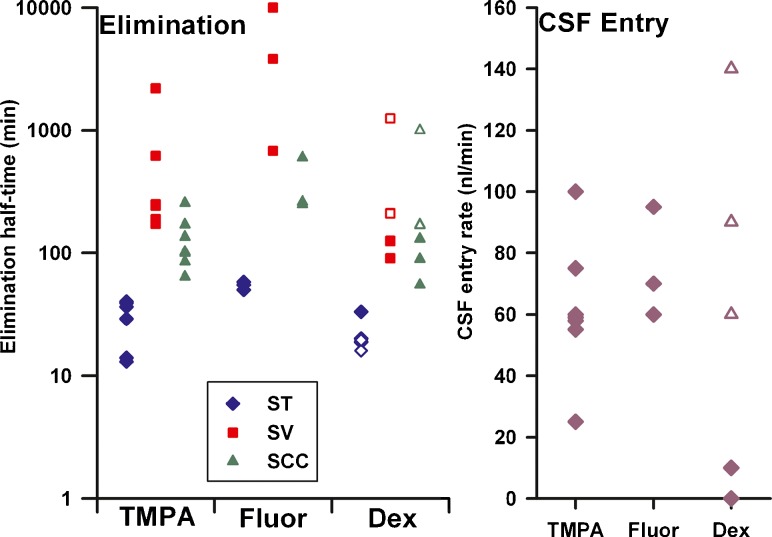
Perilymph pharmacokinetics was investigated by a novel approach, in which solutions containing drug or marker were injected from a pipette sealed into the perilymphatic space of the lateral semi-circular canal (LSCC). The cochlear aqueduct provides the outlet for fluid flow so this procedure allows almost the entire perilymph to be exchanged. After wait times of up to 4 h the injection pipette was removed and multiple, sequential samples of perilymph were collected from the LSCC. Fluid efflux at this site results from cerebrospinal fluid (CSF) entry into the basal turn of scala tympani (ST) so the samples allow drug levels from different locations in the ear to be defined. This method allows the rate of elimination of substances from the inner ear to be determined more reliably than with other delivery methods in which drug may only be applied to part of the ear. Results were compared for the markers trimethylphenylammonium (TMPA) and fluorescein and for the drug dexamethasone (Dex). For each substance, the concentration in fluid samples showed a progressive decrease as the delay time between injection and sampling was increased. This is consistent with the elimination of substance from the ear with time. The decline with time was slowest for fluorescein, was fastest for Dex, with TMPA at an intermediate rate. Simulations of the experiments showed that elimination occurred more rapidly from scala tympani (ST) than from scala vestibuli (SV). Calculated elimination half-times from ST averaged 54.1, 24.5 and 22.5 min for fluorescein, TMPA and Dex respectively and from SV 1730, 229 and 111 min respectively. The elimination of Dex from ST occurred considerably faster than previously appreciated. These pharmacokinetic parameters provide an important foundation for understanding of drug treatments of the inner ear.


Figures

FIG. 1
FIG. 1
In vivo recordings of TMPA concentration during lateral semi-circular canal (LSCC) injections. A: TMPA concentration measured simultaneously from ion-selective electrodes sealed into ST and SV of the basal turn during two injections (of 7 min and 20 min duration) of 2 mM TMPA solution into the lateral canal at 1 μL/min. B: Computer simulation of the experiment in an anatomically-based model, with injections driving volume flow from the LSCC injection site towards the cochlear aqueduct through the perilymphatic spaces of the lateral canal, vestibule, scala vestibuli and scala tympani. The inset figure shows the initial measured and calculated time courses in ST shown enlarged. The increase of ST concentration during the initial period when SV concentration was elevated was used to quantify the rate of local cross-communication between ST and SV in the basal turn.
FIG. 2
FIG. 2
Schematic showing how perilymph of the ear can be filled with drug solution by injection from a pipette sealed into the semi-circular canal. During injection, fluid is displaced through the cochlear aqueduct into the cerebrospinal fluid (CSF).
FIG. 3
FIG. 3
A: Summary of sequentially-collected perilymph sample concentrations at various delay times following a 30 min injection of 2 mM TMPA into the LSCC. Each curve is the average of the number of experiments shown. B: Samples were each nominally 2 μL in volume and represent fluid from different inner ear locations from the LSCC sampling site to the cochlear aqueduct in the base of ST as indicated. C and D: Individual samples for different experiments normalized with respect to the measured injected concentration in each experiment and fitted with exponential curves as a function of delay time. E: Half-times of curves fitted to each sample group. Samples originating from the vestibule and scala vestibuli (samples 2–4) declined at a slower rate (with longer half-times) than those originating from scala tympani (samples 5–7).
FIG. 4
FIG. 4
Sample concentration depends on the duration of TMPA injection. In these experiments injection duration was varied from 15 min to 90 min, with sampling taking place 2 h after the injection ended. Bars indicate standard deviation. Concentrations were normalized with respect to the measured concentration of the injected solution in each experiment. For 15 and 30 min injections, lower concentrations were measured than with 60 and 90 min injections, suggesting the perilymph and adjacent tissues was not fully loaded with the briefer injections.
FIG. 5
FIG. 5
Sequential perilymph samples taken at different delay times after fluorescein injection into the LSCC. Concentrations are shown normalized with respect to the measured concentration injected in each experiment. Fluorescein concentration declines very slowly with time, with initial samples (1–3) showing the vestibule and basal SV retained over 60 % of the injected fluorescent at 4 h (240 min) after injection. Bars indicate SD.
FIG. 6
FIG. 6
Sequential perilymph samples taken at different delay times after dexamethasone injection into the LSCC. Concentrations are shown normalized with respect to the measured concentration injected in each experiment. Dexamethasone concentration declines quickly with time. Initial samples (1–3) show levels near 50 % of the injected concentration at 60 min, falling to below 20 % at 240 min. Bars indicate SD.
FIG. 7
FIG. 7
Mean curves for three substances measured by sequential sampling with a 120 min delay after a 60 min injection into the LSCC. Concentrations were normalized with respect to the measured concentration of the injected solution in each experiment. Fluorescein shows the highest curve, showing it is eliminated most slowly from the cochlea. Dexamethasone (mDex) shows the lowest curve, indicating it is eliminated most rapidly from the cochlea. The TMPA curve falls at an intermediate level.
FIG. 8
FIG. 8
Determination of kinetic parameters by computer simulations of the experiments. Open symbols: Mean sample curves for mDex (upper panel ) and Fluorescein (lower panel) at three delay times after injection, fitted by computer simulations, shown by solid symbols. The parameters used to fit the curves are given in Table 1.
FIG. 9
FIG. 9
Experimental sample data and fitted curves for 3 experiments in which DexP was injected into the LSCC and sampled after a delay of 120 min (n = 1) and 180 min (n = 2). Measured data are the sum of DexP and dex base, normalized with respect to the injected concentration. The parameters used to fit the model curves are given in Table 1.
FIG. 10
FIG. 10
Summary of kinetic parameters derived from simulation of LSCC injection / sampling data. The one fluorescein experiment which was fitted with no elimination from SV is shown at the upper limit of the plot. For dexamethasone, solid symbols show parameters for mDex and open symbols show parameters for DexP.
FIG. 11
FIG. 11
Cochlear sensitivity changes measured during 60 min injections of artificial perilymph (Control, n = 3), of fluorescein (n = 8) or of mDex (n = 9) at the concentrations used in the kinetic studies. Sensitivity was assessed by CAP thresholds at the 4 frequencies indicated using an automated procedure with a criterion of 10 μV. Measurements were made at 2 min intervals but SD error bars are only shown at 20 min intervals for clarity. Threshold changes produced by mDex were almost identical to those induced by control injections. Fluorescein caused substantial elevations of CAP thresholds.

Similar articles

Cited by

References

    1. Bachmann G, Su J, Zumegen C, Wittekindt C, Michel O. Permeabilität der runden Fenstermembran für Prednisolon-21-Hydrogensuccinat. HNO. 2001;49:538–542. doi: 10.1007/s001060170078. - DOI - PubMed
    1. Bird PA, Begg EJ, Zhang M, Keast AT, Murray DP, Balkany TJ. Intratympanic versus intravenous delivery of methylprednisolone to cochlear perilymph. Otol Neurotol. 2007;28:1124–1130. doi: 10.1097/MAO.0b013e31815aee21. - DOI - PubMed
    1. Bird PA, Murray DP, Zhang M, Begg EJ. Intratympanic versus intravenous delivery of dexamethasone and dexamethasone sodium phosphate to cochlear perilymph. Otol Neurotol. 2011;32:933–936. doi: 10.1097/MAO.0b013e3182255933. - DOI - PubMed
    1. Borden RC, Saunders JE, Berryhill WE, et al. Hyaluronic acid hydrogel sustains the delivery of dexamethasone across the round window membrane. Audiol Neurootol. 2011;16:1–11. - PubMed
    1. Chandrasekhar SS, Rubinstein RY, Kwartler JA, Gatz M, Connelly PE, Huang E, Baredes S. Dexamethasone pharmacokinetics in the inner ear: comparison of route of administration and use of facilitating agents. Otolaryngol Head Neck Surg. 2000;122:521–528. doi: 10.1016/S0194-5998(00)70094-5. - DOI - PubMed

Publication types

LinkOut - more resources