

Evolution of GOLDEN2-LIKE gene function in C(3) and C (4) plants
- PMID: 22968911
- PMCID: PMC3555242
- DOI: 10.1007/s00425-012-1754-3
Evolution of GOLDEN2-LIKE gene function in C(3) and C (4) plants
Abstract
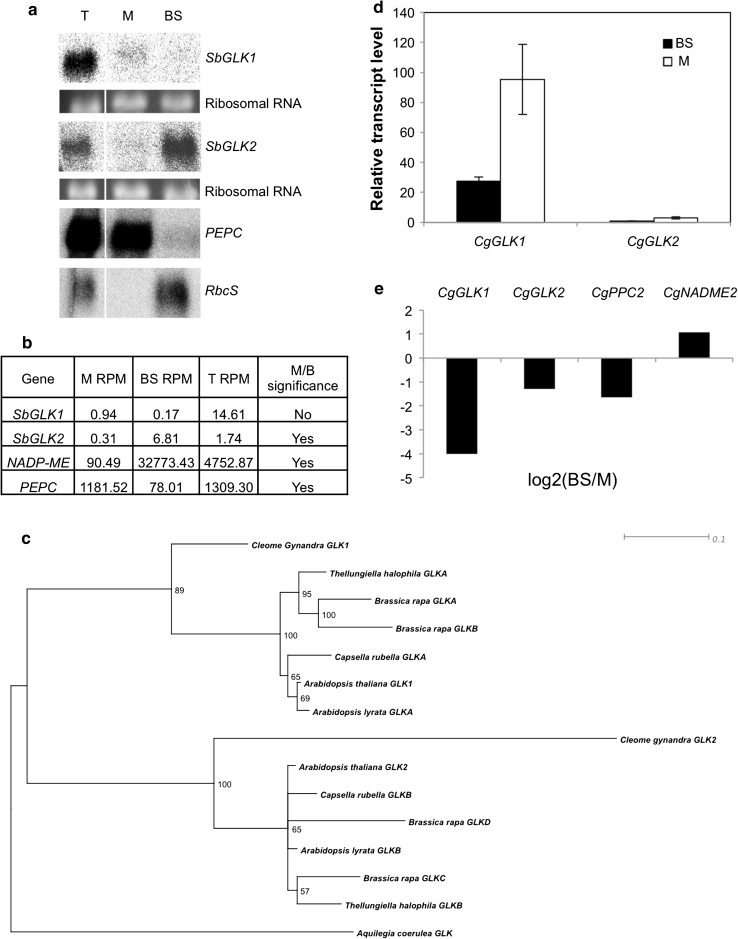
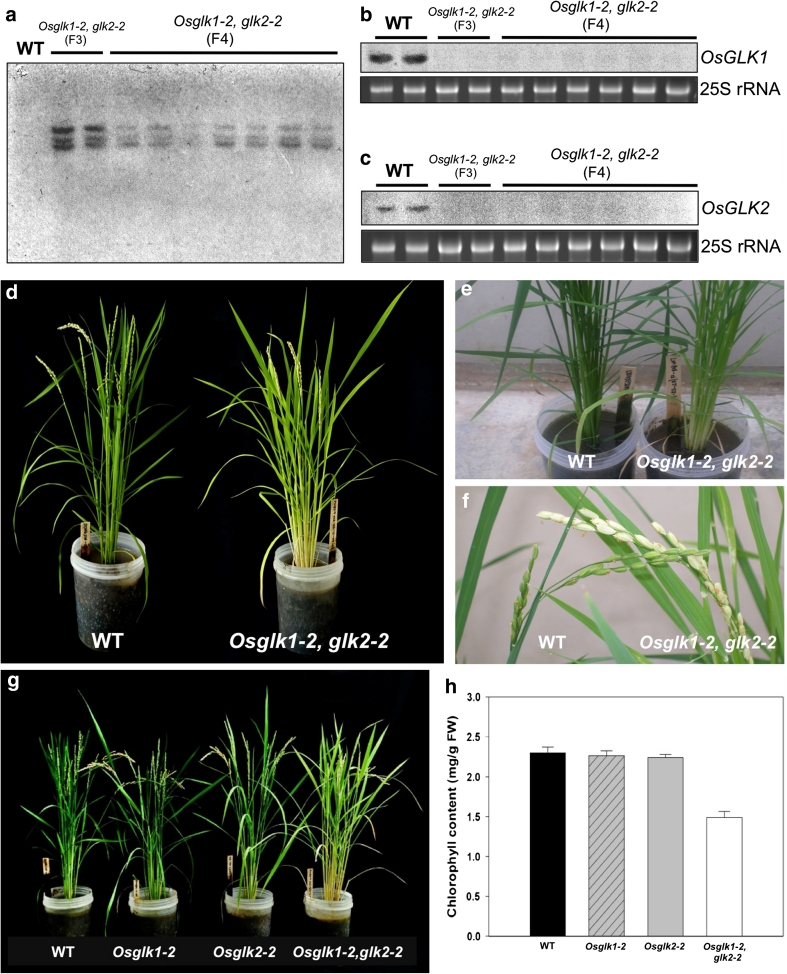
A pair of GOLDEN2-LIKE transcription factors is required for normal chloroplast development in land plant species that encompass the range from bryophytes to angiosperms. In the C(4) plant maize, compartmentalized function of the two GLK genes in bundle sheath and mesophyll cells regulates dimorphic chloroplast differentiation, whereas in the C(3) plants Physcomitrella patens and Arabidopsis thaliana the genes act redundantly in all photosynthetic cells. To assess whether the cell-specific function of GLK genes is unique to maize, we analyzed gene expression patterns in the C(4) monocot Sorghum bicolor and C(4) eudicot Cleome gynandra. Compartmentalized expression was observed in S. bicolor, consistent with the development of dimorphic chloroplasts in this species, but not in C. gynandra where bundle sheath and mesophyll chloroplasts are morphologically similar. The generation of single and double mutants demonstrated that GLK genes function redundantly in rice, as in other C(3) plants, despite the fact that GLK gene duplication in monocots preceded the speciation of rice, maize and sorghum. Together with phylogenetic analyses of GLK gene sequences, these data have allowed speculation on the evolutionary trajectory of GLK function. Based on current evidence, most species that retain single GLK genes belong to orders that contain only C(3) species. We therefore propose that the ancestral state is a single GLK gene, and hypothesize that GLK gene duplication enabled sub-functionalization, which in turn enabled cell-specific function in C(4) plants with dimorphic chloroplasts. In this scenario, GLK gene duplication preconditioned the evolution of C(4) physiology that is associated with chloroplast dimorphism.
Figures


Similar articles
-
The maize golden2 gene defines a novel class of transcriptional regulators in plants.Plant Cell. 2001 May;13(5):1231-44. doi: 10.1105/tpc.13.5.1231. Plant Cell. 2001. PMID: 11340194 Free PMC article.
-
GLK transcription factors regulate chloroplast development in a cell-autonomous manner.Plant J. 2008 Nov;56(3):432-44. doi: 10.1111/j.1365-313X.2008.03616.x. Epub 2008 Aug 4. Plant J. 2008. PMID: 18643989
-
Specialization of the Golden2-like regulatory pathway during land plant evolution.New Phytol. 2009;183(1):133-141. doi: 10.1111/j.1469-8137.2009.02829.x. Epub 2009 Mar 30. New Phytol. 2009. PMID: 19383092
-
[Biological function and molecular mechanism of the transcription factor GLKs in plants: a review].Sheng Wu Gong Cheng Xue Bao. 2022 Aug 25;38(8):2700-2712. doi: 10.13345/j.cjb.220099. Sheng Wu Gong Cheng Xue Bao. 2022. PMID: 36002404 Review. Chinese.
-
ABC1K atypical kinases in plants: filling the organellar kinase void.Trends Plant Sci. 2012 Sep;17(9):546-55. doi: 10.1016/j.tplants.2012.05.010. Epub 2012 Jun 11. Trends Plant Sci. 2012. PMID: 22694836 Free PMC article. Review.
Cited by
-
Genome-wide characterization and analysis of Golden 2-Like transcription factors related to leaf chlorophyll synthesis in diploid and triploid Eucalyptus urophylla.Front Plant Sci. 2022 Jul 28;13:952877. doi: 10.3389/fpls.2022.952877. eCollection 2022. Front Plant Sci. 2022. PMID: 35968152 Free PMC article.
-
Rice Phytochrome-Interacting Factor-Like1 (OsPIL1) is involved in the promotion of chlorophyll biosynthesis through feed-forward regulatory loops.J Exp Bot. 2017 Jul 10;68(15):4103-4114. doi: 10.1093/jxb/erx231. J Exp Bot. 2017. PMID: 28922754 Free PMC article.
-
Genome-Wide Identification of GLK Family Genes in Phoebe bournei and Their Transcriptional Analysis Under Abiotic Stresses.Int J Mol Sci. 2025 Mar 7;26(6):2387. doi: 10.3390/ijms26062387. Int J Mol Sci. 2025. PMID: 40141031 Free PMC article.
-
Sunflower HaGLK Enhances Photosynthesis, Grain Yields, and Stress Tolerance of Rice.Biology (Basel). 2025 Jul 27;14(8):946. doi: 10.3390/biology14080946. Biology (Basel). 2025. PMID: 40906084 Free PMC article.
-
Photosynthesis of root chloroplasts developed in Arabidopsis lines overexpressing GOLDEN2-LIKE transcription factors.Plant Cell Physiol. 2013 Aug;54(8):1365-77. doi: 10.1093/pcp/pct086. Epub 2013 Jun 7. Plant Cell Physiol. 2013. PMID: 23749810 Free PMC article.
References
-
- Audic S, Claverie JM. The significance of digital gene expression profiles. Genome Res. 1997;7:986–995. - PubMed
Publication types
MeSH terms
Substances
Grants and funding
LinkOut - more resources
Full Text Sources
Molecular Biology Databases
Miscellaneous
