. 2012 Oct 11;53(11):7087-96.
doi: 10.1167/iovs.12-10295.

Fluid circulation determined in the isolated bovine lens

Affiliations

Fluid circulation determined in the isolated bovine lens

Oscar A Candia et al. Invest Ophthalmol Vis Sci. .

Abstract

Purpose: In 1997, a theoretical model was developed that predicted the existence of an internal, Na(+)-driven fluid circulation from the poles to the equator of the lens. In the present work, we demonstrate with a novel system that fluid movement can be measured across the polar and equatorial surface areas of isolated cow lenses. We have also determined the effects of ouabain and reduced bath [Na(+)].

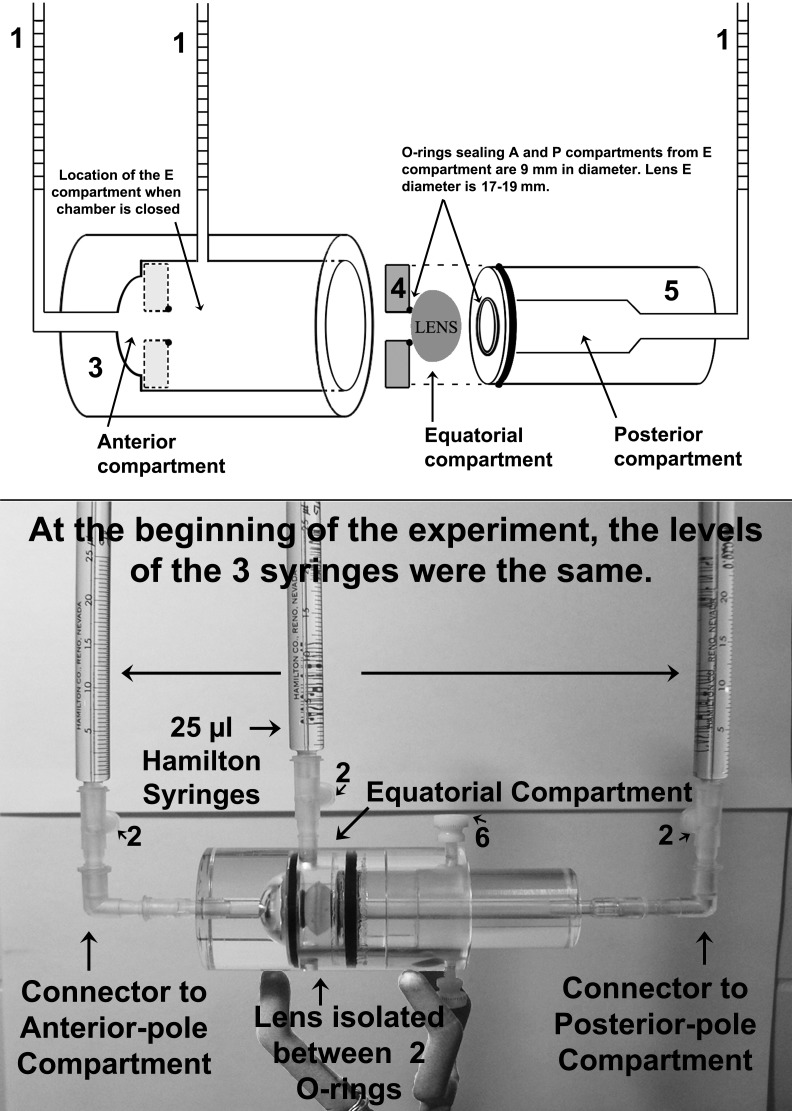
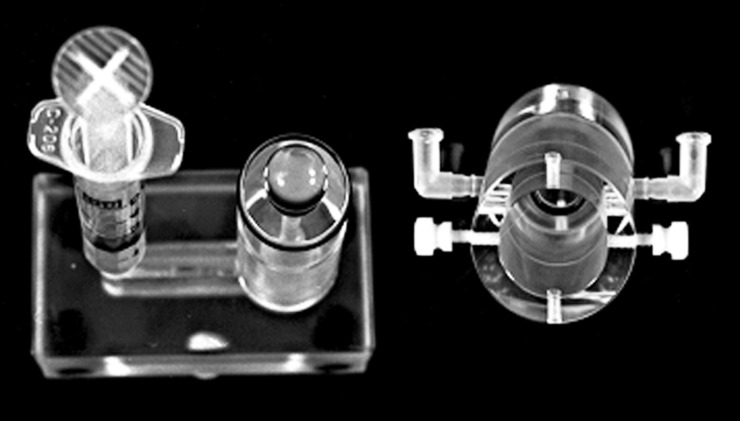
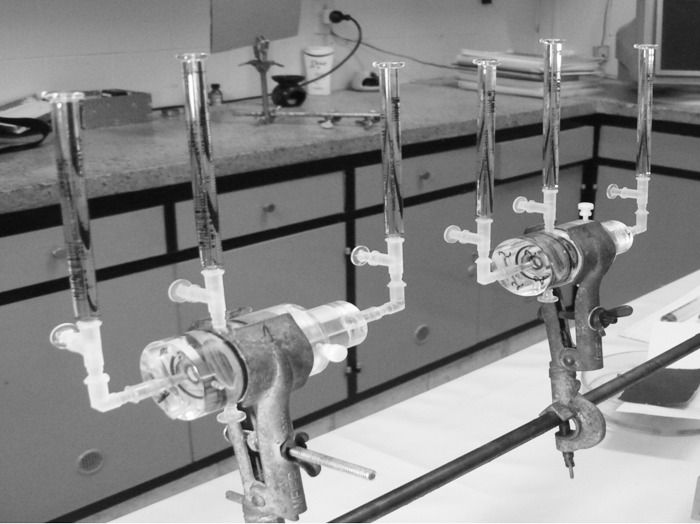
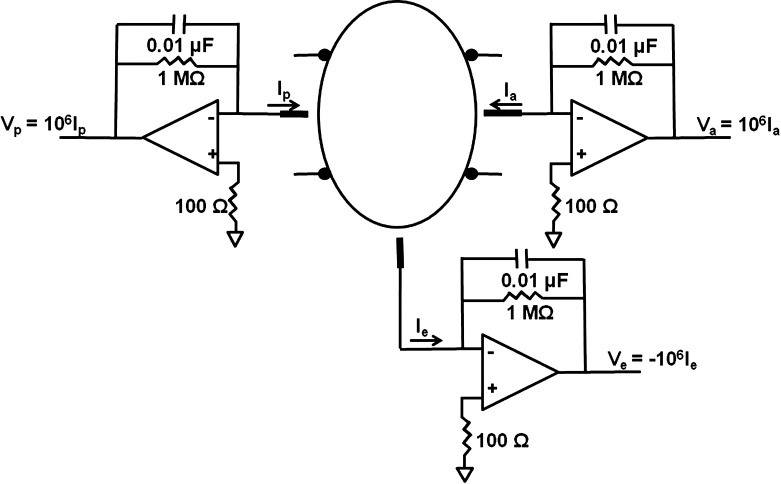
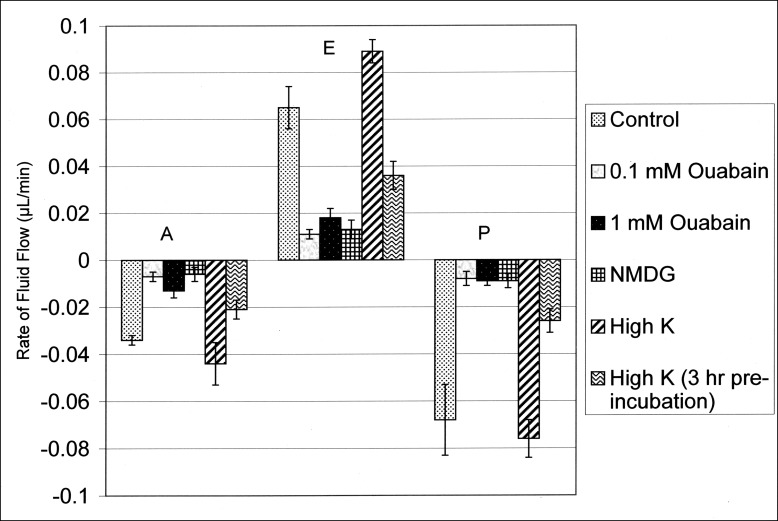
Methods: Lenses were isolated in a chamber with three compartments separated by two thin O-rings. Each compartment, anterior (A), equatorial (E), and posterior (P), was connected to a vertical capillary graduated in 0.25 μL. Capillary levels were read every 15 minutes. The protocols consisted of 2 hours in either open circuit or short circuit. The effects of ouabain and low-Na(+) solutions were determined under open circuit.

Results: In 21 experiments, the E capillary increased at a mean rate of 0.060 μL/min while the A and P levels decreased at rates of 0.044 and 0.037 μL/min, respectively, closely accounting for the increase in E. The first-hour flows under short circuit were approximately 40% larger than those in open-circuit conditions. The first-hour flows were always larger than those during the second hour. Preincubation of lenses with either ouabain or low-[Na(+)] solutions resulted in reduced rates of fluid transport. When KCl was used to replace NaCl, a transitory stimulation of fluid transport occurred.

Conclusions: These experiments support that a fluid circulation consistent with the 1997 model is physiologically active.


Conflict of interest statement

Disclosure: O.A. Candia, None; R. Mathias, None; R. Gerometta, None

Figures

Figure 1.
Figure 1.
Schematic diagram (upper panel) and photograph of replete chamber assembly with lens isolated within the three-compartment chamber used for these volumetric measurements (lower panel). Numbers in the diagram and photograph label the components in the chamber assembly, which are (1) 25 μL Hamilton syringes with 0.25 μL divisions; (2) leakproof Luer connectors; (3) body of the Lucite chamber with cylindrical cavity to accommodate piston (component 5); (4) washer that can accommodate O-rings of different diameters to adapt to the size of the lens—it lies flat against the bottom of the cylinder held by a layer of grease; (5) piston with its central O-ring that touches the lens and seals the center (equatorial) compartment from the posterior compartment (see Fig. 2); (6) screw to hold piston in place after all adjustments are made. Abbreviations: A, anterior; E, equatorial; P, posterior.
Figure 2.
Figure 2.
Photograph of lens sitting on the piston's O-ring with anterior epithelial surface facing upward, and, to the right, the cylinder that will be slid over the lens-piston prior to connecting the Hamilton syringes.
Figure 3.
Figure 3.
Photograph of two chambers set up during an open-circuit experiment; that is, the T-connectors between the glass Hamilton syringes and the Lucite chamber were closed with plugs (seen at a right angle to the glass capillaries). For short-circuit experiments, the plugs were removed and Ag/AgCl electrodes were inserted into the connectors (not shown).
Figure 4.
Figure 4.
Circuit diagram for the short-circuiting device that was used.
Figure 5.
Figure 5.
Summary plot of data (means ± SEMs) from Tables 4 through 8 for fluid flows across the anterior (A), equatorial (E), and posterior (P) surfaces during the first hour. Control values are from Table 2. Fluid flow in each compartment in the presence of an experimental perturbation is significantly different from its respective control value as unpaired two-tailed data (P < 0.05), except for the values of the flows in the A and P compartments for the high-K+ condition, where the flows are indistinguishable from their respective control values, P > 0.55, as unpaired two-tailed data. The flow in the E compartment for this latter condition (0.089 μL/min) is significantly higher than its control value, 0.065 μL/min (P < 0.05).

References

    1. Mathias RT, Rae JL, Baldo GJ. Physiological properties of the normal lens. Physiol Rev. 1997;77:21–50 - PubMed
    1. Mathias RT, Kistler J, Donaldson P. The lens circulation. J Membr Biol. 2007;216:1–16 - PubMed
    1. Donaldson PJ, Musil LS, Mathias RT. Point: a critical appraisal of the lens circulation model--an experimental paradigm for understanding the maintenance of lens transparency? Invest Ophthalmol Vis Sci. 2010;51:2303–2306 - PMC - PubMed
    1. Robinson KR, Patterson JW. Localization of steady currents in the lens. Curr Eye Res. 1982;2:843–847 - PubMed
    1. Patterson JW. Characterization of the equatorial current of the lens. Ophthalmic Res. 1988;20:139–142 - PubMed

Publication types

MeSH terms