

Characterization of an actin-targeting ADP-ribosyltransferase from Aeromonas hydrophila
- PMID: 22969084
- PMCID: PMC3481304
- DOI: 10.1074/jbc.M112.397612
Characterization of an actin-targeting ADP-ribosyltransferase from Aeromonas hydrophila
Abstract
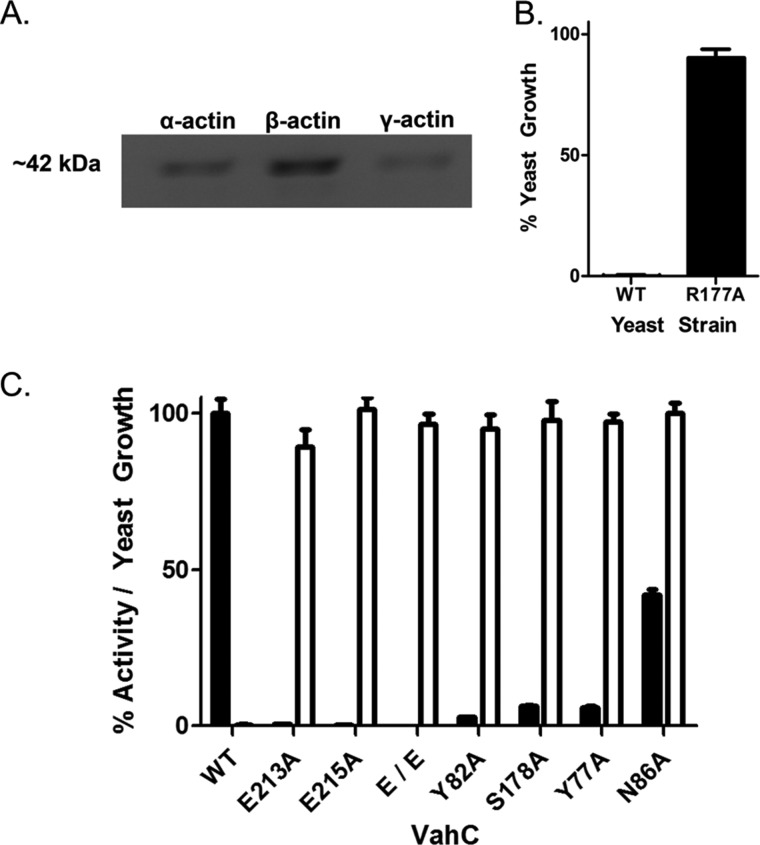
The mono-ADP-ribosyltransferase (mART) toxins are contributing factors to a number of human diseases, including cholera, diphtheria, traveler's diarrhea, and whooping cough. VahC is a cytotoxic, actin-targeting mART from Aeromonas hydrophila PPD134/91. This bacterium is implicated primarily in diseases among freshwater fish species but also contributes to gastrointestinal and extraintestinal infections in humans. VahC was shown to ADP-ribosylate Arg-177 of actin, and the kinetic parameters were K(m)(NAD(+)) = 6 μM, K(m)(actin) = 24 μM, and k(cat) = 22 s(-1). VahC activity caused depolymerization of actin filaments, which induced caspase-mediated apoptosis in HeLa Tet-Off cells. Alanine-scanning mutagenesis of predicted catalytic residues showed the predicted loss of in vitro mART activity and cytotoxicity. Bioinformatic and kinetic analysis also identified three residues in the active site loop that were critical for the catalytic mechanism. A 1.9 Å crystal structure supported the proposed roles of these residues and their conserved nature among toxin homologues. Several small molecules were characterized as inhibitors of in vitro VahC mART activity and suramin was the best inhibitor (IC(50) = 20 μM). Inhibitor activity was also characterized against two other actin-targeting mART toxins. Notably, these inhibitors represent the first report of broad spectrum inhibition of actin-targeting mART toxins.
Figures


Similar articles
-
Photox, a novel actin-targeting mono-ADP-ribosyltransferase from Photorhabdus luminescens.J Biol Chem. 2010 Apr 30;285(18):13525-34. doi: 10.1074/jbc.M109.077339. Epub 2010 Feb 24. J Biol Chem. 2010. PMID: 20181945 Free PMC article.
-
Characterization of the catalytic signature of Scabin toxin, a DNA-targeting ADP-ribosyltransferase.Biochem J. 2018 Jan 5;475(1):225-245. doi: 10.1042/BCJ20170818. Biochem J. 2018. PMID: 29208763
-
Structural basis of actin recognition and arginine ADP-ribosylation by Clostridium perfringens iota-toxin.Proc Natl Acad Sci U S A. 2008 May 27;105(21):7399-404. doi: 10.1073/pnas.0801215105. Epub 2008 May 19. Proc Natl Acad Sci U S A. 2008. PMID: 18490658 Free PMC article.
-
Novel bacterial ADP-ribosylating toxins: structure and function.Nat Rev Microbiol. 2014 Sep;12(9):599-611. doi: 10.1038/nrmicro3310. Epub 2014 Jul 14. Nat Rev Microbiol. 2014. PMID: 25023120 Free PMC article. Review.
-
Reaction Mechanism of Mono-ADP-Ribosyltransferase Based on Structures of the Complex of Enzyme and Substrate Protein.Curr Top Microbiol Immunol. 2015;384:69-87. doi: 10.1007/82_2014_415. Curr Top Microbiol Immunol. 2015. PMID: 24990621 Review.
Cited by
-
Antagonistic Effects of Actin-Specific Toxins on Salmonella Typhimurium Invasion into Mammalian Cells.Biomolecules. 2024 Nov 9;14(11):1428. doi: 10.3390/biom14111428. Biomolecules. 2024. PMID: 39595604 Free PMC article.
-
Development of Anti-Virulence Therapeutics against Mono-ADP-Ribosyltransferase Toxins.Toxins (Basel). 2020 Dec 25;13(1):16. doi: 10.3390/toxins13010016. Toxins (Basel). 2020. PMID: 33375750 Free PMC article. Review.
-
An In-Silico Sequence-Structure-Function Analysis of the N-Terminal Lobe in CT Group Bacterial ADP-Ribosyltransferase Toxins.Toxins (Basel). 2019 Jun 21;11(6):365. doi: 10.3390/toxins11060365. Toxins (Basel). 2019. PMID: 31234283 Free PMC article.
-
Arginine ADP-ribosylation mechanism based on structural snapshots of iota-toxin and actin complex.Proc Natl Acad Sci U S A. 2013 Mar 12;110(11):4267-72. doi: 10.1073/pnas.1217227110. Epub 2013 Feb 4. Proc Natl Acad Sci U S A. 2013. PMID: 23382240 Free PMC article.
-
Antagonistic effects of actin-specific toxins on Salmonella Typhimurium invasion into mammalian cells.bioRxiv [Preprint]. 2024 Jul 2:2024.07.01.601609. doi: 10.1101/2024.07.01.601609. bioRxiv. 2024. Update in: Biomolecules. 2024 Nov 09;14(11):1428. doi: 10.3390/biom14111428. PMID: 39005411 Free PMC article. Updated. Preprint.
References
-
- Miller M. B., Bassler B. L. (2001) Quorum sensing in bacteria. Annu. Rev. Microbiol. 55, 165–199 - PubMed
-
- Nizet V. (2007) Understanding how leading bacterial pathogens subvert innate immunity to reveal novel therapeutic targets. J. Allergy Clin. Immunol. 120, 13–22 - PubMed
-
- Clatworthy A. E., Pierson E., Hung D. T. (2007) Targeting virulence. A new paradigm for antimicrobial therapy. Nat. Chem. Biol. 3, 541–548 - PubMed
-
- Escaich S. (2008) Antivirulence as a new antibacterial approach for chemotherapy. Curr. Opin. Chem. Biol. 12, 400–408 - PubMed
Publication types
MeSH terms
Substances
Grants and funding
LinkOut - more resources
Full Text Sources
Molecular Biology Databases
Miscellaneous
