

Network analysis of the focal adhesion to invadopodia transition identifies a PI3K-PKCα invasive signaling axis
- PMID: 22969158
- PMCID: PMC3583194
- DOI: 10.1126/scisignal.2002964
Network analysis of the focal adhesion to invadopodia transition identifies a PI3K-PKCα invasive signaling axis
Abstract
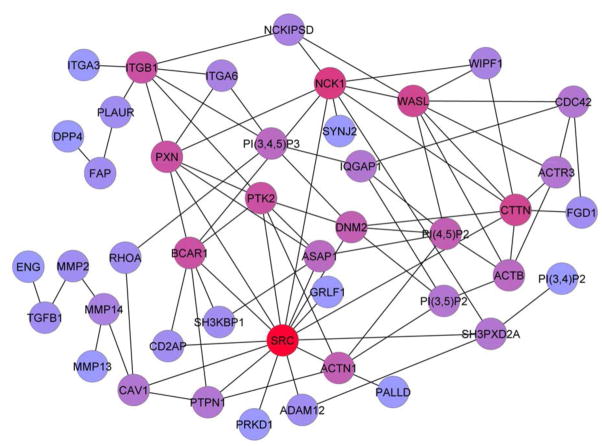
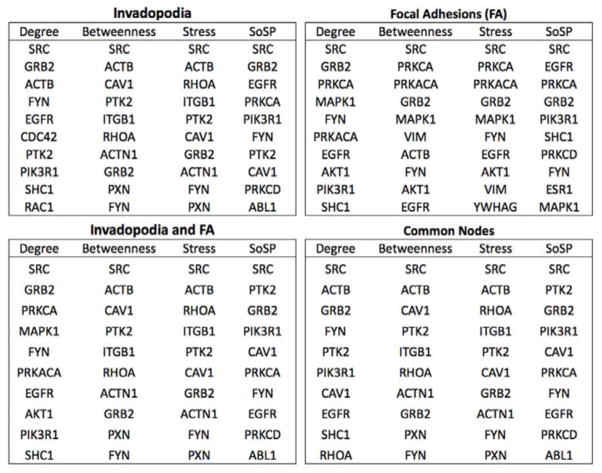
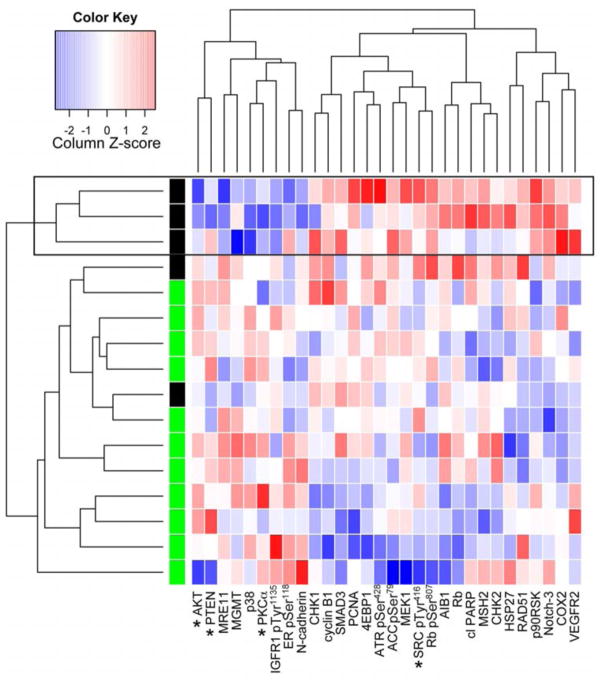
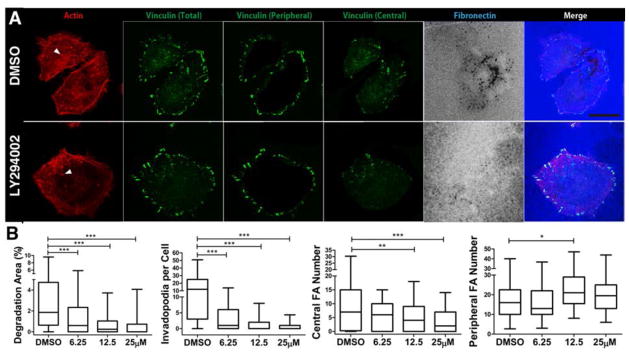
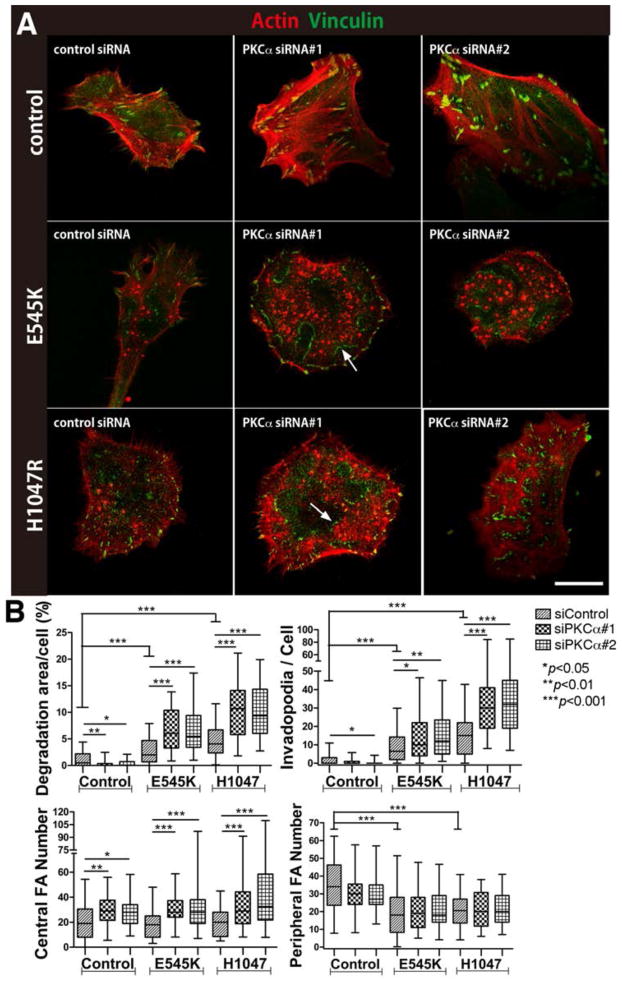
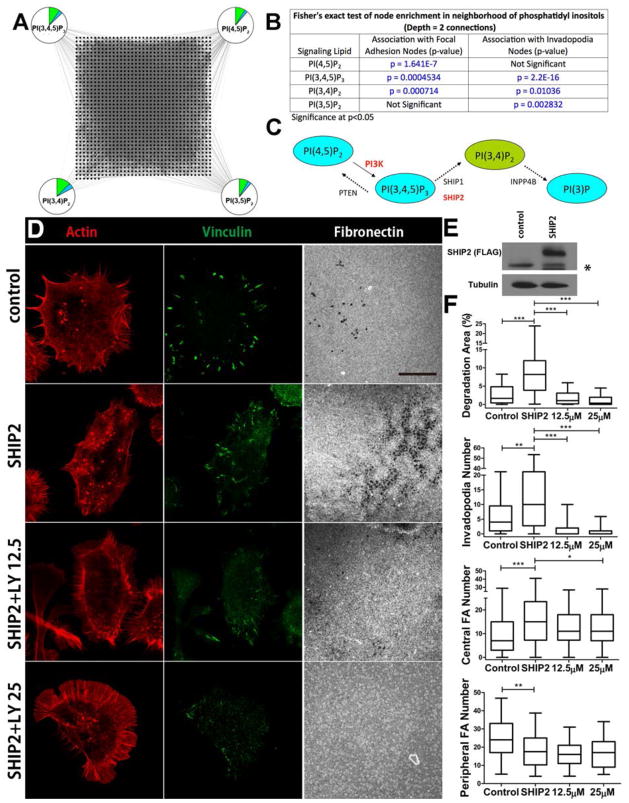
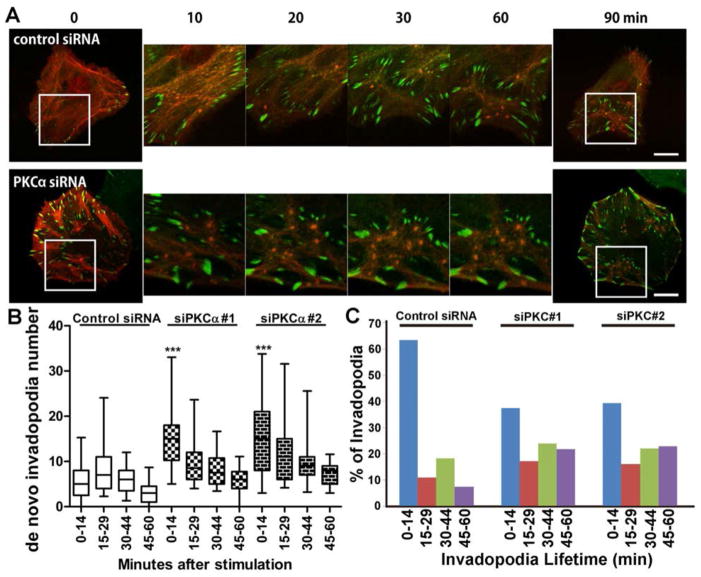
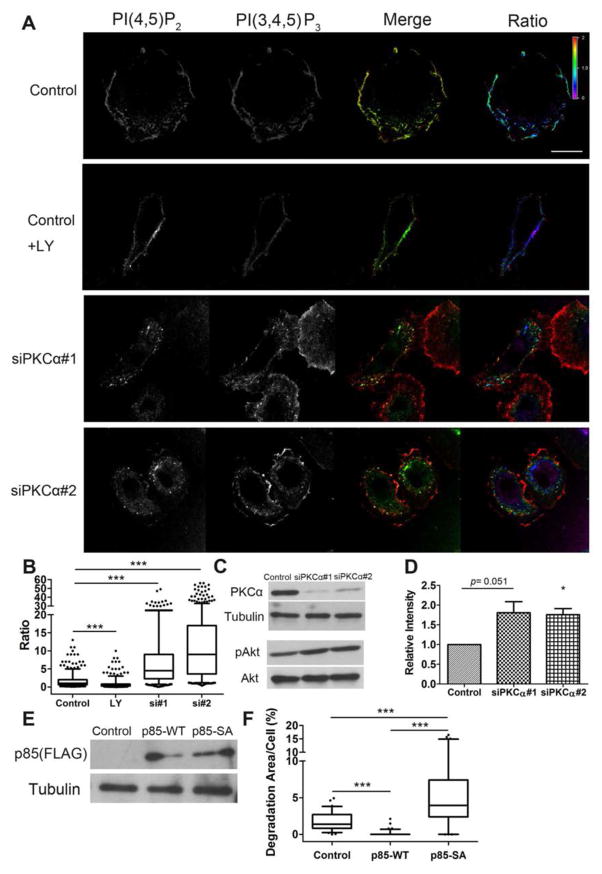
In cancer, deregulated signaling can produce an invasive cellular phenotype. We modeled the invasive transition as a theoretical switch between two cytoskeletal structures: focal adhesions and extracellular matrix-degrading invadopodia. We constructed molecular interaction networks of each structure and identified upstream regulatory hubs through computational analyses. We compared these regulatory hubs to the status of signaling components from head and neck carcinomas, which led us to analyze phosphatidylinositol 3-kinase (PI3K) and protein kinase C α (PKCα). Consistent with previous studies, PI3K activity promoted both the formation and the activity of invadopodia. We found that PI3K induction of invadopodia was increased by overexpression of SH2 (Src homology 2) domain-containing inositol 5'-phosphatase 2 (SHIP2), which converts the phosphatidylinositol 3,4,5-trisphosphate [PI(3,4,5)P(3)] that is produced by PI3K activity to phosphatidylinositol 3,4-bisphosphate [PI(3,4)P(2)], which is believed to promote invadopodia formation. Knockdown of PKCα had divergent effects on invadopodia formation, depending on the status of PI3K. Loss of PKCα inhibited invadopodia formation in cells with wild-type PI3K pathway status. Conversely, in cells with constitutively active PI3K (through activating PI3K mutants or lacking the endogenous opposing enzyme PTEN), PKCα knockdown increased invadopodia formation. Mechanistic studies revealed a negative feedback loop from PKCα that dampened PI3K activity and invasive behavior in cells with genetic hyperactivation of the PI3K pathway. These studies demonstrated the potential of network modeling as a discovery tool and identified PI3K and PKCα as interacting regulators of invasive behavior.
Conflict of interest statement
Figures
Similar articles
-
Silencer of death domains (SODD) inhibits skeletal muscle and kidney enriched inositol 5-phosphatase (SKIP) and regulates phosphoinositide 3-kinase (PI3K)/Akt signaling to the actin cytoskeleton.J Biol Chem. 2011 Aug 26;286(34):29758-70. doi: 10.1074/jbc.M111.263103. Epub 2011 Jun 28. J Biol Chem. 2011. PMID: 21712384 Free PMC article.
-
Dual role of SRC homology domain 2-containing inositol phosphatase 2 in the regulation of platelet-derived growth factor and insulin-like growth factor I signaling in rat vascular smooth muscle cells.Endocrinology. 2003 Sep;144(9):4204-14. doi: 10.1210/en.2003-0190. Endocrinology. 2003. PMID: 12933696
-
Phosphoinositide 3-kinase signaling pathway mediated by p110α regulates invadopodia formation.J Cell Biol. 2011 Jun 27;193(7):1275-88. doi: 10.1083/jcb.201009126. J Cell Biol. 2011. PMID: 21708979 Free PMC article.
-
The role of SHIP in cytokine-induced signaling.Rev Physiol Biochem Pharmacol. 2003;149:87-103. doi: 10.1007/s10254-003-0016-y. Epub 2003 Apr 12. Rev Physiol Biochem Pharmacol. 2003. PMID: 12692707 Review.
-
Phosphatidylinositol (3,4) bisphosphate-specific phosphatases and effector proteins: A distinct branch of PI3K signaling.Cell Signal. 2015 Sep;27(9):1789-98. doi: 10.1016/j.cellsig.2015.05.013. Epub 2015 May 27. Cell Signal. 2015. PMID: 26022180 Review.
Cited by
-
Expression of human papillomavirus oncoproteins E6 and E7 inhibits invadopodia activity but promotes cell migration in HPV-positive head and neck squamous cell carcinoma cells.Cancer Rep (Hoboken). 2018 Oct;1(3):e1125. doi: 10.1002/cnr2.1125. Epub 2018 Jul 27. Cancer Rep (Hoboken). 2018. PMID: 32721084 Free PMC article.
-
Quantitative proteomic analysis reveals effects of epidermal growth factor receptor (EGFR) on invasion-promoting proteins secreted by glioblastoma cells.Mol Cell Proteomics. 2014 Oct;13(10):2618-31. doi: 10.1074/mcp.M114.040428. Epub 2014 Jul 5. Mol Cell Proteomics. 2014. PMID: 24997998 Free PMC article.
-
PTEN and Other PtdIns(3,4,5)P3 Lipid Phosphatases in Breast Cancer.Int J Mol Sci. 2020 Dec 2;21(23):9189. doi: 10.3390/ijms21239189. Int J Mol Sci. 2020. PMID: 33276499 Free PMC article. Review.
-
Invadopodia in cancer metastasis: dynamics, regulation, and targeted therapies.J Transl Med. 2025 May 16;23(1):548. doi: 10.1186/s12967-025-06526-y. J Transl Med. 2025. PMID: 40380267 Free PMC article. Review.
-
The oncolytic avian reovirus p17 protein suppresses invadopodia formation via disruption of TKs5 complexes and oncogenic signaling pathways.Front Cell Infect Microbiol. 2025 Jun 12;15:1603124. doi: 10.3389/fcimb.2025.1603124. eCollection 2025. Front Cell Infect Microbiol. 2025. PMID: 40575485 Free PMC article.
References
-
- Hanahan D, Weinberg RA. The hallmarks of cancer. Cell. 2000;100:57. - PubMed
-
- Monsky WL, Lin CY, Aoyama A, Kelly T, Akiyama SK, Mueller SC, Chen WT. A potential marker protease of invasiveness, seprase, is localized on invadopodia of human malignant melanoma cells. Cancer Res. 1994;54:5702. - PubMed
-
- Raz A, Geiger B. Altered organization of cell-substrate contacts and membrane-associated cytoskeleton in tumor cell variants exhibiting different metastatic capabilities. Cancer Res. 1982;42:5183. - PubMed
-
- Buccione R, Orth JD, McNiven MA. Foot and mouth: podosomes, invadopodia and circular dorsal ruffles. Nat Rev Mol Cell Biol. 2004;5:647. - PubMed
Publication types
MeSH terms
Substances
Grants and funding
LinkOut - more resources
Full Text Sources
Other Literature Sources
Medical
Research Materials
Miscellaneous
