. 2010 Aug;40(1):285-327.
doi: 10.1111/j.1467-9531.2010.01223.x.

Respondent-Driven Sampling: An Assessment of Current Methodology

Affiliations

Respondent-Driven Sampling: An Assessment of Current Methodology

Krista J Gile et al. Sociol Methodol. 2010 Aug.

Abstract

Respondent-Driven Sampling (RDS) employs a variant of a link-tracing network sampling strategy to collect data from hard-to-reach populations. By tracing the links in the underlying social network, the process exploits the social structure to expand the sample and reduce its dependence on the initial (convenience) sample.The current estimators of population averages make strong assumptions in order to treat the data as a probability sample. We evaluate three critical sensitivities of the estimators: to bias induced by the initial sample, to uncontrollable features of respondent behavior, and to the without-replacement structure of sampling.Our analysis indicates: (1) that the convenience sample of seeds can induce bias, and the number of sample waves typically used in RDS is likely insufficient for the type of nodal mixing required to obtain the reputed asymptotic unbiasedness; (2) that preferential referral behavior by respondents leads to bias; (3) that when a substantial fraction of the target population is sampled the current estimators can have substantial bias.This paper sounds a cautionary note for the users of RDS. While current RDS methodology is powerful and clever, the favorable statistical properties claimed for the current estimates are shown to be heavily dependent on often unrealistic assumptions. We recommend ways to improve the methodology.


Figures

Figure 1
Figure 1
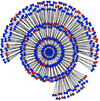
Network used to illustrate convergence of sampling probabilities
Figure 2
Figure 2
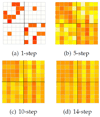
Draw-wise sampling probabilities for with-replacement random walk process on network, conditional on starting node, for steps 1 through 9. The legend gives the probabilities corresponding to each color.
Figure 3
Figure 3
Illustration of simulated sample beginning with 10 seeds (inner circle), including 2 infected (red), and continuing through four full and a fifth partial wave to obtain a sample of 500.
Figure 4
Figure 4
V-H estimators varying the number of waves (a) and homophily (b). (a) considers samples of 6 waves (from 6 seeds - first, third, and fifth boxes), and 4 waves (from 20 seeds). (b) considers samples with standard (first, third, and fifth boxes), and elevated homophily. Both consider seeds selected from all uninfected nodes (first two boxes), random nodes with respect to infection (second two boxes), and all infected nodes (last two boxes).
Figure 5
Figure 5
One, five, ten, and fourteen step transition probabilities for highly clustered network. The colors represent the probabilities according to the scale in Figure 2.
Figure 6
Figure 6
V-H estimators from samples of 6 seeds, 6 waves (first, third, and fifth boxes), and 20 seeds, 4 waves, from seeds selected from all uninfected nodes (first two boxes), random nodes with respect to infection (second two boxes), and all infected nodes (last two boxes). Seeds are discarded from all estimators. Additional early waves discarded from second, third, and forth plots.
Figure 7
Figure 7
V-H estimators from samples with unbiased referral (first, third, and fifth boxes), and referral 20% more likely for infected partners, from seeds selected from all uninfected nodes (first two boxes), random nodes with respect to infection (second two boxes), and all infected nodes (last two boxes).
Figure 8
Figure 8
Heuristic depiction of the mapping from nodal degree to sampling probability for full population sample (horizontal line) and random walk model (diagonal line).
Figure 9
Figure 9
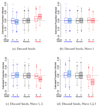
V-H estimators from samples of size 500 constituting about 50%, 60%, 70%, 80%, 90%, and 95% of the population. All seeds selected with probability proportional to degree independent of infection status. Subfigures with varying degrees of elevated activity of infected nodes (w).
Figure 10
Figure 10
Bias of the Current RDS estimator from samples of size 500 constituting about 50%, 60%, 70%, 80%, 90%, and 95% of the population, for varying degrees of elevated activity of infected nodes (w).
Figure 11
Figure 11
V-H estimators from samples with replacement consisting of 6 waves (from 6 seeds, first, third, and fifth boxes), and 4 waves (from 20 seeds), from seeds selected from all uninfected nodes (first two boxes), random nodes with respect to infection (second two boxes), and all infected nodes (last two boxes).

References

    1. Abdul-Quader Abu S, Heckathorn Douglas D, McKnight Courtney, Bramson Heidi, Nemeth Chris, Sabin Keith, Gallagher Kathleen, Des Jarlais Don C. Effectiveness of Respondent-Driven Sampling for Recruiting Drug Users in New York City: Findings from a Pilot Study. Journal of Urban Health. 2006;83:459–476. - PMC - PubMed
    1. Barndorff-Nielsen Ole E. Information and Exponential Families in Statistical Theory. New York: Wiley; 1978.
    1. Bernhardt Annette, Heckathorn Douglas, Milkman Ruth, Theodore Nikolas. Documenting Unregulated Work: A Survey of Workplace Violations in New York City. The Future of Work. 2006
    1. CDC Consultation. Consultation on Respondent-Driven Sampling: Discussion. Atlanta, Georgia: 2008. Feb 12,
    1. Persi Diaconis. The Markov chain Monte Carlo revolution. Bulletin of the American Mathematical Society. 2009;46:179–205.