

Contrast-enhanced ultrasonography parameters in neural network diagnosis of liver tumors
- PMID: 22969209
- PMCID: PMC3436061
- DOI: 10.3748/wjg.v18.i32.4427
Contrast-enhanced ultrasonography parameters in neural network diagnosis of liver tumors
Abstract
Aim: To study the role of time-intensity curve (TIC) analysis parameters in a complex system of neural networks designed to classify liver tumors.
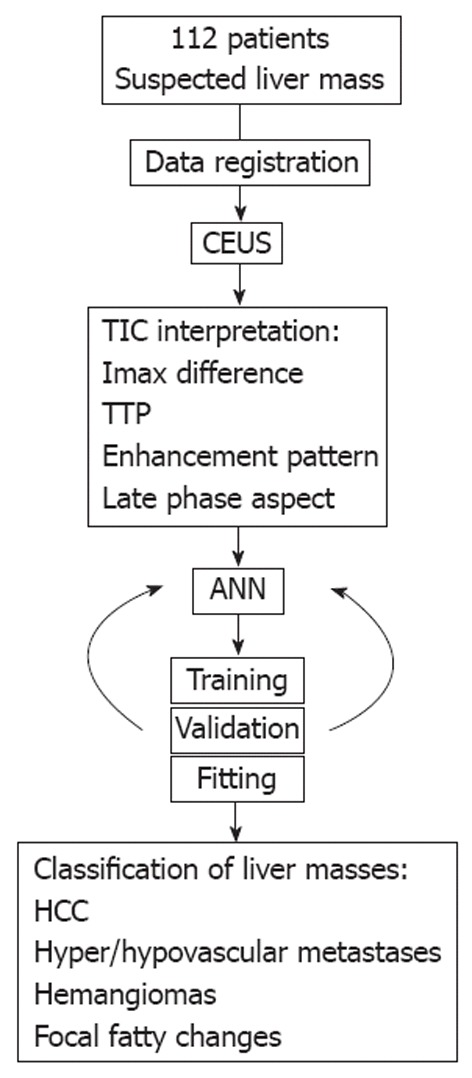
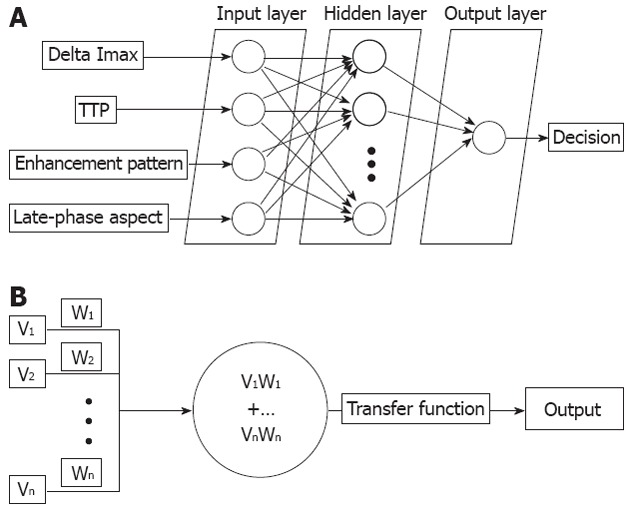
Methods: We prospectively included 112 patients with hepatocellular carcinoma (HCC) (n = 41), hypervascular (n = 20) and hypovascular (n = 12) liver metastases, hepatic hemangiomas (n = 16) or focal fatty changes (n = 23) who underwent contrast-enhanced ultrasonography in the Research Center of Gastroenterology and Hepatology, Craiova, Romania. We recorded full length movies of all contrast uptake phases and post-processed them offline by selecting two areas of interest (one for the tumor and one for the healthy surrounding parenchyma) and consecutive TIC analysis. The difference in maximum intensities, the time to reaching them and the aspect of the late/portal phase, as quantified by the neural network and a ratio between median intensities of the central and peripheral areas were analyzed by a feed forward back propagation multi-layer neural network which was trained to classify data into five distinct classes, corresponding to each type of liver lesion.
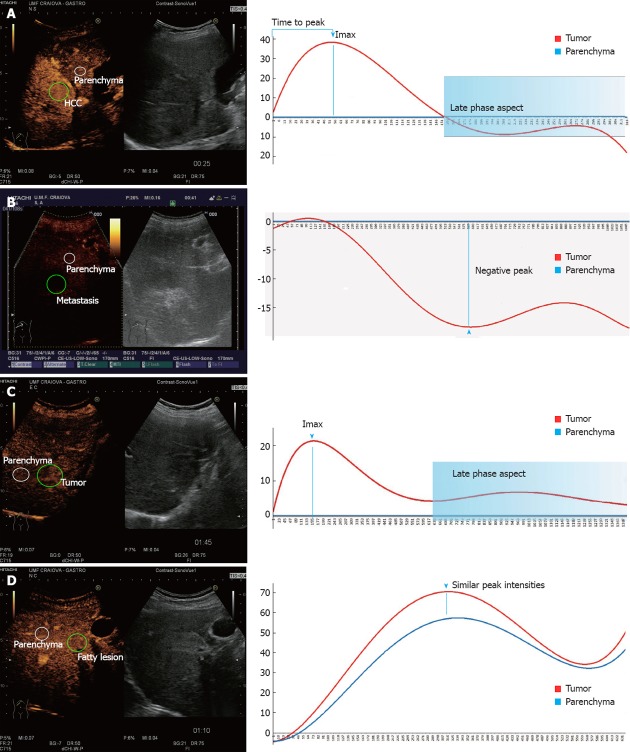
Results: The neural network had 94.45% training accuracy (95% CI: 89.31%-97.21%) and 87.12% testing accuracy (95% CI: 86.83%-93.17%). The automatic classification process registered 93.2% sensitivity, 89.7% specificity, 94.42% positive predictive value and 87.57% negative predictive value. The artificial neural networks (ANN) incorrectly classified as hemangyomas three HCC cases and two hypervascular metastases, while in turn misclassifying four liver hemangyomas as HCC (one case) and hypervascular metastases (three cases). Comparatively, human interpretation of TICs showed 94.1% sensitivity, 90.7% specificity, 95.11% positive predictive value and 88.89% negative predictive value. The accuracy and specificity of the ANN diagnosis system was similar to that of human interpretation of the TICs (P = 0.225 and P = 0.451, respectively). Hepatocellular carcinoma cases showed contrast uptake during the arterial phase followed by wash-out in the portal and first seconds of the late phases. For the hypovascular metastases did not show significant contrast uptake during the arterial phase, which resulted in negative differences between the maximum intensities. We registered wash-out in the late phase for most of the hypervascular metastases. Liver hemangiomas had contrast uptake in the arterial phase without agent wash-out in the portal-late phases. The focal fatty changes did not show any differences from surrounding liver parenchyma, resulting in similar TIC patterns and extracted parameters.
Conclusion: Neural network analysis of contrast-enhanced ultrasonography - obtained TICs seems a promising field of development for future techniques, providing fast and reliable diagnostic aid for the clinician.
Keywords: Artificial neural network; Computer-aided diagnosis system; Contrast enhanced ultrasound; Hepatocellular carcinoma; Liver tumors; Time-intensity curve.
Figures
Similar articles
-
Computer-aided diagnosis for the classification of focal liver lesions by use of contrast-enhanced ultrasonography.Med Phys. 2008 May;35(5):1734-46. doi: 10.1118/1.2900109. Med Phys. 2008. PMID: 18561648 Free PMC article.
-
Prospective study of differential diagnosis of hepatic tumors by pattern-based classification of contrast-enhanced sonography.World J Gastroenterol. 2006 Oct 21;12(39):6290-8. doi: 10.3748/wjg.v12.i39.6290. World J Gastroenterol. 2006. PMID: 17072951 Free PMC article.
-
The usefulness of 1.5 harmonic imaging ultrasonography with Levovist in the diagnosis of focal hepatic tumors.Int J Oncol. 2005 Oct;27(4):989-95. Int J Oncol. 2005. PMID: 16142315
-
Contrast enhanced ultrasound (CEUS) in the evaluation of liver metastases.Med Ultrason. 2010 Sep;12(3):233-7. Med Ultrason. 2010. PMID: 21203602 Review.
-
Evaluation of focal hepatic lesions with ultrasound contrast agents.J Clin Ultrasound. 2011 Sep;39(7):399-407. doi: 10.1002/jcu.20847. Epub 2011 Jun 14. J Clin Ultrasound. 2011. PMID: 21674510 Review.
Cited by
-
Diagnostic Performance of an Artificial Intelligence Model Based on Contrast-Enhanced Ultrasound in Patients with Liver Lesions: A Comparative Study with Clinicians.Diagnostics (Basel). 2023 Nov 5;13(21):3387. doi: 10.3390/diagnostics13213387. Diagnostics (Basel). 2023. PMID: 37958282 Free PMC article.
-
An Automated Method for Classifying Liver Lesions in Contrast-Enhanced Ultrasound Imaging Based on Deep Learning Algorithms.Diagnostics (Basel). 2023 Mar 10;13(6):1062. doi: 10.3390/diagnostics13061062. Diagnostics (Basel). 2023. PMID: 36980369 Free PMC article.
-
Deep learning radiomics for focal liver lesions diagnosis on long-range contrast-enhanced ultrasound and clinical factors.Quant Imaging Med Surg. 2022 Jun;12(6):3213-3226. doi: 10.21037/qims-21-1004. Quant Imaging Med Surg. 2022. PMID: 35655832 Free PMC article.
-
A novel model for predicting fatty liver disease by means of an artificial neural network.Gastroenterol Rep (Oxf). 2020 Aug 24;9(1):31-37. doi: 10.1093/gastro/goaa035. eCollection 2021 Jan. Gastroenterol Rep (Oxf). 2020. PMID: 33747524 Free PMC article.
-
Application of artificial intelligence in the diagnosis of hepatocellular carcinoma.eGastroenterology. 2023 Nov 30;1(2):e100002. doi: 10.1136/egastro-2023-100002. eCollection 2023 Sep. eGastroenterology. 2023. PMID: 39944000 Free PMC article. Review.
References
-
- El-Serag HB. Hepatocellular carcinoma. N Engl J Med. 2011;365:1118–1127. - PubMed
-
- European Association For The Study Of The Liver; European Organisation For Research And Treatment Of Cancer. EASL-EORTC clinical practice guidelines: management of hepatocellular carcinoma. J Hepatol. 2012;56:908–943. - PubMed
-
- Dietrich CF. Characterisation of focal liver lesions with contrast enhanced ultrasonography. Eur J Radiol. 2004;51 Suppl:S9–17. - PubMed
Publication types
MeSH terms
LinkOut - more resources
Full Text Sources
Other Literature Sources
Medical
