

Clade age and species richness are decoupled across the eukaryotic tree of life
- PMID: 22969411
- PMCID: PMC3433737
- DOI: 10.1371/journal.pbio.1001381
Clade age and species richness are decoupled across the eukaryotic tree of life
Abstract
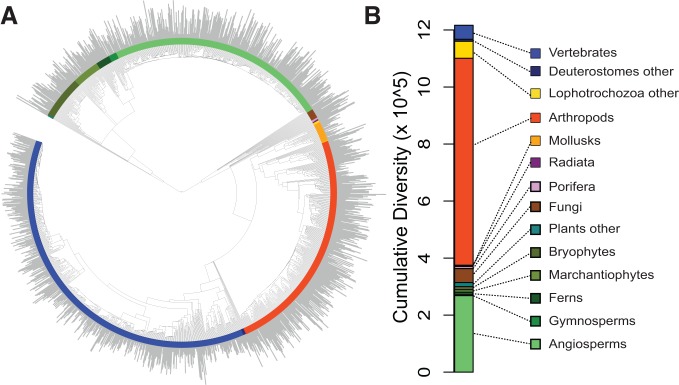
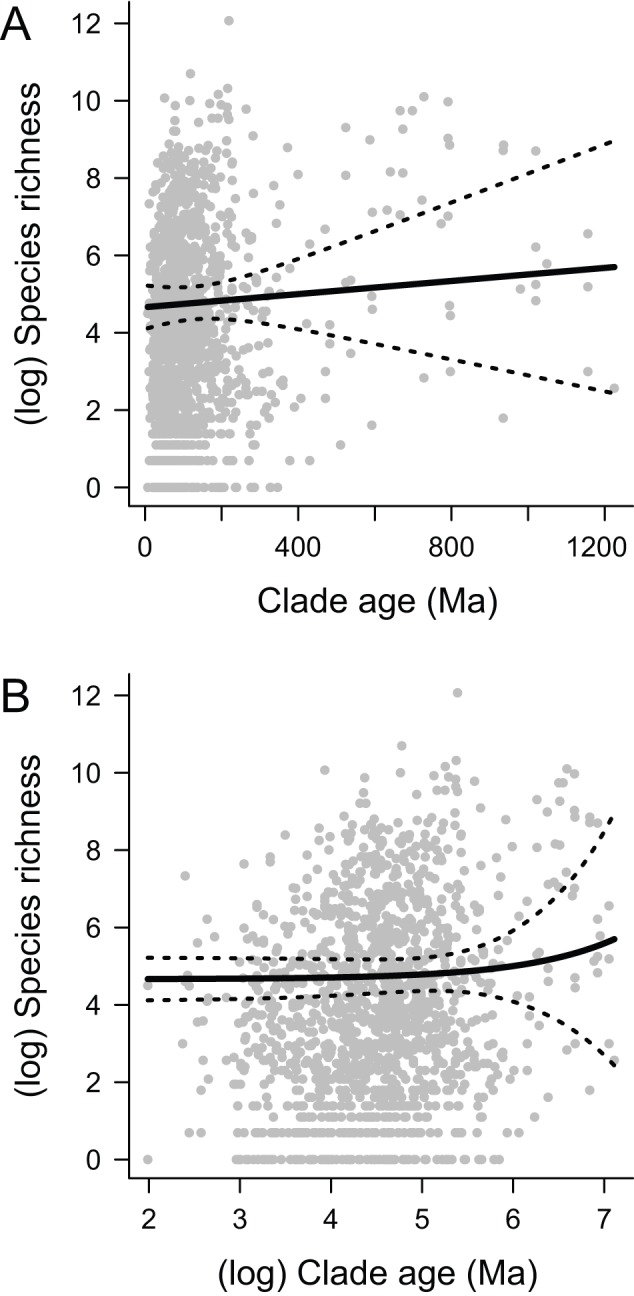
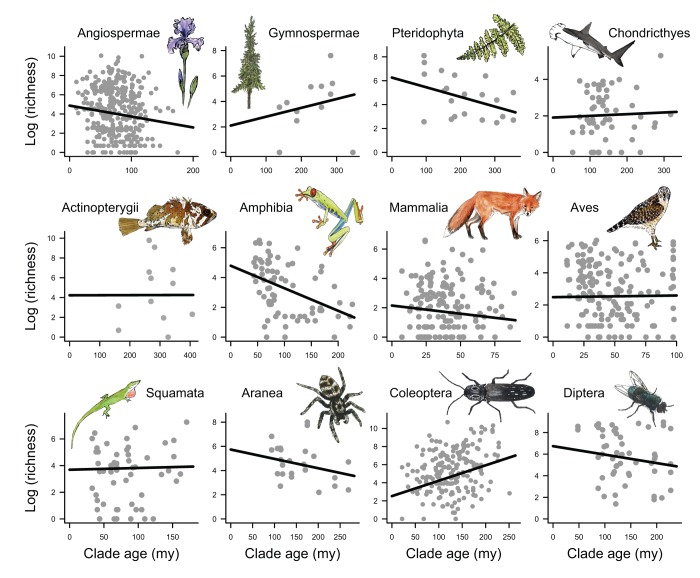
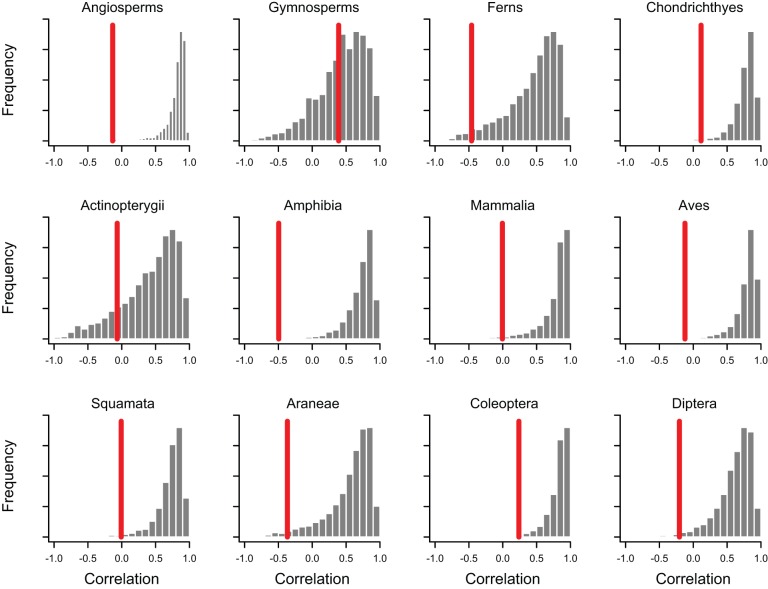
Explaining the dramatic variation in species richness across the tree of life remains a key challenge in evolutionary biology. At the largest phylogenetic scales, the extreme heterogeneity in species richness observed among different groups of organisms is almost certainly a function of many complex and interdependent factors. However, the most fundamental expectation in macroevolutionary studies is simply that species richness in extant clades should be correlated with clade age: all things being equal, older clades will have had more time for diversity to accumulate than younger clades. Here, we test the relationship between stem clade age and species richness across 1,397 major clades of multicellular eukaryotes that collectively account for more than 1.2 million described species. We find no evidence that clade age predicts species richness at this scale. We demonstrate that this decoupling of age and richness is unlikely to result from variation in net diversification rates among clades. At the largest phylogenetic scales, contemporary patterns of species richness are inconsistent with unbounded diversity increase through time. These results imply that a fundamentally different interpretative paradigm may be needed in the study of phylogenetic diversity patterns in many groups of organisms.
Conflict of interest statement
The authors have declared that no competing interests exist.
Figures
Comment in
-
An inordinate fondness for eukaryotic diversity.PLoS Biol. 2012 Aug;10(8):e1001382. doi: 10.1371/journal.pbio.1001382. Epub 2012 Aug 28. PLoS Biol. 2012. PMID: 22952431 Free PMC article.
Similar articles
-
Testing the Relationships between Diversification, Species Richness, and Trait Evolution.Syst Biol. 2016 Nov;65(6):975-988. doi: 10.1093/sysbio/syw029. Epub 2016 Apr 4. Syst Biol. 2016. PMID: 27048703
-
Diversification rates and species richness across the Tree of Life.Proc Biol Sci. 2016 Sep 14;283(1838):20161334. doi: 10.1098/rspb.2016.1334. Proc Biol Sci. 2016. PMID: 27605507 Free PMC article.
-
Clade age and diversification rate variation explain disparity in species richness among water scavenger beetle (Hydrophilidae) lineages.PLoS One. 2014 Jun 2;9(6):e98430. doi: 10.1371/journal.pone.0098430. eCollection 2014. PLoS One. 2014. PMID: 24887453 Free PMC article.
-
The causes of species richness patterns across space, time, and clades and the role of "ecological limits".Q Rev Biol. 2011 Jun;86(2):75-96. doi: 10.1086/659883. Q Rev Biol. 2011. PMID: 21800635 Review.
-
Time Explains Regional Richness Patterns within Clades More Often than Diversification Rates or Area.Am Nat. 2019 Apr;193(4):514-529. doi: 10.1086/702253. Epub 2019 Feb 20. Am Nat. 2019. PMID: 30912972
Cited by
-
Origins of Biodiversity.PLoS Biol. 2016 Nov 2;14(11):e2000724. doi: 10.1371/journal.pbio.2000724. eCollection 2016 Nov. PLoS Biol. 2016. PMID: 27806048 Free PMC article.
-
The enigmatic tropical alpine flora on the African sky islands is young, disturbed, and unsaturated.Proc Natl Acad Sci U S A. 2022 May 31;119(22):e2112737119. doi: 10.1073/pnas.2112737119. Epub 2022 May 26. Proc Natl Acad Sci U S A. 2022. PMID: 35617436 Free PMC article.
-
What limits the morphological disparity of clades?Interface Focus. 2015 Dec 6;5(6):20150042. doi: 10.1098/rsfs.2015.0042. Interface Focus. 2015. PMID: 26640649 Free PMC article.
-
Asian primate species richness correlates with rainfall.PLoS One. 2013;8(1):e54995. doi: 10.1371/journal.pone.0054995. Epub 2013 Jan 30. PLoS One. 2013. PMID: 23383023 Free PMC article.
-
Natural Constraints to Species Diversification.PLoS Biol. 2016 Aug 9;14(8):e1002532. doi: 10.1371/journal.pbio.1002532. eCollection 2016 Aug. PLoS Biol. 2016. PMID: 27505866 Free PMC article.
References
-
- Raup DM, Gould SJ, Schopf TJM, Simberloff D (1973) Stochastic models of phylogeny and evolution of diversity. J Geol 81: 525–542.
