. 2012 Aug;10(8):e1001383.
doi: 10.1371/journal.pbio.1001383. Epub 2012 Aug 28.

Stat5 signaling specifies basal versus stress erythropoietic responses through distinct binary and graded dynamic modalities

Affiliations

Stat5 signaling specifies basal versus stress erythropoietic responses through distinct binary and graded dynamic modalities

Ermelinda Porpiglia et al. PLoS Biol. 2012 Aug.

Abstract

Erythropoietin (Epo)-induced Stat5 phosphorylation (p-Stat5) is essential for both basal erythropoiesis and for its acceleration during hypoxic stress. A key challenge lies in understanding how Stat5 signaling elicits distinct functions during basal and stress erythropoiesis. Here we asked whether these distinct functions might be specified by the dynamic behavior of the Stat5 signal. We used flow cytometry to analyze Stat5 phosphorylation dynamics in primary erythropoietic tissue in vivo and in vitro, identifying two signaling modalities. In later (basophilic) erythroblasts, Epo stimulation triggers a low intensity but decisive, binary (digital) p-Stat5 signal. In early erythroblasts the binary signal is superseded by a high-intensity graded (analog) p-Stat5 response. We elucidated the biological functions of binary and graded Stat5 signaling using the EpoR-HM mice, which express a "knocked-in" EpoR mutant lacking cytoplasmic phosphotyrosines. Strikingly, EpoR-HM mice are restricted to the binary signaling mode, which rescues these mice from fatal perinatal anemia by promoting binary survival decisions in erythroblasts. However, the absence of the graded p-Stat5 response in the EpoR-HM mice prevents them from accelerating red cell production in response to stress, including a failure to upregulate the transferrin receptor, which we show is a novel stress target. We found that Stat5 protein levels decline with erythroblast differentiation, governing the transition from high-intensity graded signaling in early erythroblasts to low-intensity binary signaling in later erythroblasts. Thus, using exogenous Stat5, we converted later erythroblasts into high-intensity graded signal transducers capable of eliciting a downstream stress response. Unlike the Stat5 protein, EpoR expression in erythroblasts does not limit the Stat5 signaling response, a non-Michaelian paradigm with therapeutic implications in myeloproliferative disease. Our findings show how the binary and graded modalities combine to generate high-fidelity Stat5 signaling over the entire basal and stress Epo range. They suggest that dynamic behavior may encode information during STAT signal transduction.


Conflict of interest statement

The authors have declared that no competing interests exist.

Figures

Figure 1
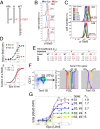
Figure 1. The p-Stat5 response in fetal liver.
(A) Flow cytometric Ter119/CD71 profile of freshly isolated fetal liver at E13.5, fixed and permeabilized in preparation for intracellular p-Stat5 measurements. Subsets S0 to S4 (left histogram) contain erythroblasts of increasing maturation, as seen from their morphological appearance in cytospin preparations (stained with Giemsa and diaminobenzidine). The right histogram shows the further division of S3 cells into small and large subsets based on the flow-cytometric “forward scatter” parameter. (B) Specificity of the Alexa 647-conjugated anti-p-Stat5 antibody (BD Biosciences # 612599). Upper panels, response of S1 cells from either wild-type or Stat5−/− fetal livers to Epo stimulation (2 U/ml) for 15 min (red histograms). Blue histograms are baseline fluorescence in the absence of Epo. Lower panels, Epo-stimulated (2 U/ml; 15 min, red histograms) or unstimulated (blue histograms) S1 cells in wild-type fetal liver, either treated or untreated with λ-phosphatase prior to p-Stat5 staining. Numbers in all panels indicate the fraction (%) of p-Stat5 positive cells within the indicated horizontal gates. (C) The three measures used to analyze the p-Stat5 response to Epo (9 U/ml, 15 min, red histogram) in S3 erythroblasts. The black histogram corresponds to pre-stimulation cells of the same subset. (i) “total p-Stat5 median fluorescence intensity (MFI)” (upper panel), the p-Stat5 MFI of the entire S3-subset population, represented by the shaded red histogram. This measure does not distinguish between signaling and nonsignaling cells. (ii) “p-Stat5+ cells(%)” (lower panel), cells within the p-Stat5+ gate, shaded in red, expressed as a fraction (percent) of all cells in the Epo-stimulated S3 subset. This is an estimate of the number of signaling cells. The placement of the p-Stat5+ gate was determined by reference to the baseline, pre-stimulation histogram (in black), so that no more than 1% of the unstimulated population is included within the p-Stat5+ gate. (iii) “p-Stat5 in p-Stat5+ cells” (lower panel), estimates the p-Stat5 MFI in signaling cells only. (D) Response of S1 and S3 erythroblasts to Epo stimulation. Freshly isolated fetal liver cells were deprived of Epo for 90 min and were then stimulated with a range of Epo concentrations as indicated, from 0.004 to 9 U/ml, for 15 min. Colored flow-cytometry histograms correspond to Epo-stimulated cells, black histograms in each panel correspond to unstimulated cells (Epo = 0). An overlay of the responses is shown in the two lowest panels. For each Epo concentration, three measures of the p-Stat5 response, as illustrated in (C), are noted next to each flow-cytometry histogram in blue, black, and green, corresponding to the total p-Stat5 MFI, to the p-Stat5+ cells (%), and to the p-Stat5 in p-Stat5+ cells, respectively. Each of these measures is then plotted as a function of Epo concentration (right panels); the color of each symbol in these plots corresponds to the color of the respective flow-cytometry histogram for the same Epo concentration. (E) The p-Stat5 response to a range of Epo concentrations at 15 min post-stimulation. Summary of five independent experiments similar to Panel D. Data (mean ± SE) for each experiment were normalized by expressing each p-Stat5 MFI reading as a ratio to the p-Stat5 MFI in p-Stat5+ cells of the “S3 large” subset following stimulation with 1 U/ml Epo for 15 min. Data in the upper two panels were fitted with Hill curves.
Figure 2
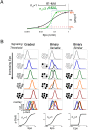
Figure 2. Measurement of binary and graded signaling responses by flow cytometry.
(A) Dose/response curves for graded and binary (switch-like) responses. The grey line shows an idealized switch response. An infinitesimally small change in stimulus such as Epo results in an increase of response from 0% to 100%. The black curve shows a graded response with nH = 1. An 81-fold increase in stimulus is required to shift the response from 10% to 90% of maximum. The green curve shows a steep, switch-like or binary dose/response curve (nH = 3). Only a 4-fold change in stimulus is required in order to generate a similar increase in response. (B) Contrasting graded and binary signaling responses: three hypothetical examples. In a graded signaling response (left panels), increasing Epo concentration results in a graded increase in p-Stat5 in individual cells, represented by increasingly darker shades of grey. Simulations of the corresponding flow-cytometric profiles show that increasing Epo concentration causes a gradual shift of the p-Stat5 fluorescence histogram to the right. A plot of the total p-Stat5 median fluorescence intensity (MFI) versus Epo concentration has Michaelian kinetics with a Hill coefficient (nH) of 1 (lower left panel, please note a log scale was used for the x-axis). In binary signaling (middle and right panels), the p-Stat5 signal in individual cells can only assume two states, either “off” (white) or “on” (black), but intermediate states (shades of grey) are unstable. Two distinct cases of binary signaling are illustrated that differ in their threshold responses. In “variable threshold” (middle panels), the threshold at which Epo causes a cell to switch from “off” to “on” varies substantially between cells of the population. Consequently, increasing Epo concentration causes a gradual increase in the number of cells that are p-Stat5+ (“on”). The simulated flow-cytometric histograms at each Epo concentration (in color) are each the sum of two histograms, corresponding to cells that are “off” (light grey histograms) and cells that are “on” (black histograms). The median fluorescence of the “on” and “off” histograms each remain unaffected by Epo concentration, but as Epo increases, the number of cells in the “on” histogram, reflected by its height, increases, with a corresponding decrease in the height of the “off” histogram. Although individual cells have binary responses, there is a graded increase in the MFI of the colored histograms representing the whole population. Therefore, a plot of total p-Stat5 MFI versus Epo concentration shows a graded response (here, the Hill coefficient is nH = 1). In the case of cells with binary responses and similar threshold (right panels), cells switch from “off” to “on” within a much narrower Epo concentration range. Consequently, the response of the whole population reflects the response of individual cells more closely. Flow-cytometric histograms representing the population tend to be in one of two principal positions, corresponding to the “on” or to the “off” states. A plot of total p-Stat5 MFI versus Epo concentration is steep, reflected by a high Hill coefficient (nH>1).
Figure 3
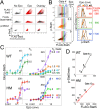
Figure 3. Binary p-Stat5 signaling in EpoR-HM mice and in mature wild-type S3.
(A) Representation of the cytoplasmic domains of wild-type EpoR or its truncated mutants, EpoR-H and EpoR-HM. Tyrosine residues are represented by red lines. Tyrosine 343 is the only remaining tyrosine in EpoR-H, and is mutated in EpoR-HM. (B) The p-Stat5 response to Epo (2 U/ml, 30 min) in S1 cells from wild-type (WT), EpoR-H (H), or EpoR-HM (HM) fetal livers on E13.5. Percentage of cells in the p-Stat5+ gate is indicated. (C) Fluorescence p-Stat5 histogram overlay of S1 cells from E13.5 wild-type (top) or EpoR-HM (bottom), stimulated with a range of Epo concentrations for 30 min. Representative of three similar experiments. S1 cells in each case are pooled from several fetal livers of the same genotype. (D) Epo dose/p-Stat5 response curves, in wild-type or EpoR-HM S1 cells; the p-Stat5 MFI data correspond to the histograms shown in (C). Data are fitted with Hill curves. The Hill curves that were fitted to the data in the top panel were re-plotted in the bottom panel and are shown as a fraction of the maximal p-Stat5 response (p-Stat5max). The p-Stat5max was calculated from fitting the Hill equation to the experimental “total p-Stat5” data. Hill coefficients (nH) are indicated. (E) Lower panel, table summarizing the Hill coefficients (nH) obtained by fitting the Hill curve to plots of “total p-Stat5 versus Epo concentration,” for each of subsets S1 to S3, in each of three independent experiments. Fetal liver cells were pooled from three or four embryos of each genotype in each experiment. Differences between nH for EpoR-HM and WT are significant at p = 0.01, paired t test. R 2 is Pearson's product moment correlation coefficient, correlating experimental data with values predicted by the Hill equation for the corresponding Epo concentrations. (F) CD71/Ter119 profile of E14.5 fetal livers (left panel). The S3 subset was further divided into serial FSC gates, each corresponding to 300 channels (middle panel). The right panel shows an overlay of Ter119 expression in FSC gates #3 and #6. (G) Epo dose/p-Stat5 response curves for the S3 FSC gates #3–6 and for S1 cells in the same fetal liver. Gate number and corresponding Hill coefficient are shown for each curve.
Figure 4
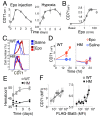
Figure 4. Maximal p-Stat5 signal intensity (p-Stat5max) is linearly correlated with Stat5 protein levels.
(A) The p-Stat5 response of S1 cells from Stat5+/− fetal liver and from littermate wild-type controls. Representative p-Stat5 fluorescence histograms are shown for the indicated Epo concentrations. (B) Plots of “total p-Stat5 versus Epo concentration” in Stat5+/− and in wild-type littermate fetal livers in experiments similar to (A), fitted with Hill curves. Data (mean ± SE) from n = 7 Stat5+/− embryos and 6 littermate controls, each analyzed separately. p-Stat5 MFI was normalized as in Figure 1E. Parameter values used for fitting the Hill curves and goodness of fit information are in Figure S7A. (C) Plots of “total p-Stat5 versus Epo concentration” in EpoR+/− and in wild-type littermate fetal livers, fitted with Hill curves. Data (mean ± SE) from n = 4 EpoR+/− embryos and 3 littermate controls, each analyzed separately. p-Stat5 MFI was normalized as in Figure 1E. Parameter values used for fitting the Hill curves and goodness of fit information are in Figure S7C. (D) Stat5 protein levels in S1 to S3, in representative wild-type (WT) and Stat5+/− embryos, using flow-cytometric measurements with an anti-Stat5 antibody, characterized in Figure S7D using Stat5−/− embryos. FMO, “fluorescence minus one” control, in which cells were labeled for all parameters (Ter119, CD71, live/dead stain) except one: the anti-Stat5 antibody was omitted and replaced with an isotype-control antibody. (E) Stat5 protein levels in subsets S1 to S3 in wild-type or Stat5+/− embryos. Individual data points correspond to data from individual embryos, measured as in panel D. Stat5 protein is expressed as a ratio to the average fluorescence signal for S1 cells in all wild-type embryos. (F) Linear correlation between Stat5 protein levels and p-Stat5max, across all subsets in Stat5+/− and wild-type embryos (R 2 = 0.85). Data points correspond to individual embryos. Stat5 protein levels are as in (D). p-Stat5max was determined by fitting Hill curves to individual embryo “total p-Stat5 versus Epo concentration” analyses, with p-Stat5 normalized as in Figure 1E.
Figure 5
Figure 5. High exogenous Stat5 levels rescue high-intensity graded p-Stat5 signaling in wild-type and EpoR-HM S3 cells.
(A) The p-Stat5 response to Epo in S3 cells expressing exogenous FLAG-Stat5. Wild-type fetal liver cells were electroporated with either FLAG-tagged Stat5a ( = FLAG-Stat5, C-terminal tag, top panels), FLAG-tagged STAT5Y694F (middle panels), or “empty vector” (pcDNA3, lower panels). Following overnight incubation in Epo (0.2 U/ml), cells were deprived of Epo for 3 h, and then either left unstimulated (left panels) or were stimulated with Epo for 30 min (response to Epo = 9 U/ml is shown; response to Epo concentrations 0.04 to 9 U/ml are shown in panels B, C). Double-headed arrows indicate persisting p-Stat5 following a 3h Epo deprivation, seen only in cells expressing high levels of FLAG-Stat5. (B) Analysis strategy for the experiment described in panel A. Dot plots of the p-Stat5 response versus FLAG-Stat5 levels are shown for three of the nine Epo concentrations examined (left panels; Epo = 0, 0.33, or 9 U/ml) in EpoR-HM S3 erythroblasts. Each dot plot was subdivided into narrow vertical gates, each containing cells of similar FLAG-Stat5 levels. Three of these gates, numbered 10 to 12, are highlighted in red, green, and blue, respectively. p-Stat5 responses to the three Epo concentrations in a given gate (left panels) were overlayed in a single histogram (right panels). For example, responses of cells in gate 10 (red) in each of the three left panels are all overlayed in the top right panel (framed red). (C) The “total p-Stat5” response to each of nine Epo concentrations for each vertical gate in panel B, fitted with a Hill curve. Analysis is shown for both wild-type (WT) S3 cells and for EpoR-HM S3 cells (HM). Gate numbers and Hill coefficients are indicated next to each curve. Data points are “total p-Stat5” (MFI±sem) for cells in a given gate. Each of the “total p-Stat5” MFI measurements was corrected by subtracting background fluorescence, given by the “total p-Stat5” MFI of cells expressing FLAG-Stat5Y694F in the same gate (see panel A). Gates 6 and 7 for wild-type cells and gates 9 and 10 for HM cells are re-plotted with an expanded y-axis. (D) Linear correlation between FLAG-Stat5 levels in each vertical gate, and the corresponding maximal p-Stat5 signal intensity (p-Stat5max), in wild-type cells (top panel, R 2 = 0.96) and EpoR-HM S3 cells (lower panel, R 2 = 0.998); analysis is of data shown in panel C. p-Stat5max is the maximal p-Stat5 response to Epo, defined by the Hill equation in Figure S3 and obtained by fitting Hill curves to the data in (C).
Figure 6
Figure 6. Stat5 functions in EpoR-HM and Stat5−/− fetal liver.
(A, B) Increased erythroblast apoptosis in Stat5−/− but not in EpoR-HM fetal liver. Freshly harvested fetal livers from E13.5 Stat5−/− or EpoR-HM embryos and from littermate or strain-matched controls were incubated in the absence of Epo for 90 min. Cells were then labeled with 7-AAD to exclude dead cells, and with Annexin V, CD71, and Ter119 to assess apoptosis. Representative histograms are shown for S1 cells in Stat5−/− fetal liver and in matched control (A), and for S1 cells of EpoR-HM fetal liver and matched control (B). Summary of Annexin-V+ cells in three independent experiments is shown in corresponding lower panels; each data point corresponds to an individual embryo, the black line is the mean for all embryos of a given genotype. Number of embryos analyzed: EpoR-HM = 15, strain and age matched controls = 20; Stat5−/− = 5, littermate controls = 5. No statistically significant difference was detected between EpoR-HM and control embryos; the difference between Stat5−/− and control embryos is significant (p = 0.0007, two-tailed t test, unequal variance). (C, D) Cell-surface CD71 in Stat5−/− and EpoR-HM fetal liver. E13.5 or E14.5 fetal liver from Stat5−/−, EpoR-HM, or matched control embryos were labeled with CD71 and Ter119. Non-viable cells were excluded with 7-AAD. Top panels show representative flow-cytometric CD71/Ter119 profiles of viable, non-fixed fetal liver cells. Lower panels show data for all Stat5−/− embryos (n = 7, each data point is an individual embryo), Stat5+/− (n = 11), and wild-type littermates (n = 8), and for EpoR-HM (n = 19) and strain-matched controls (n = 14). Difference between HM and matched control is significant (p<0.002, unpaired t test); Differences between Stat5+/−, Stat5−/−, and wild-type mice are all significant (p<0.0001, one-way ANOVA).
Figure 7
Figure 7. CD71 up-regulation is an EpoR-activated stress response that requires the high-intensity, graded p-Stat5 signal.
(A) Erythropoietic stress causes up-regulation of cell-surface CD71 on spleen EryA erythroblasts (CD71highTer119highFSChigh). At t = 0, Balb/C mice were injected with Epo subcutaneously (300 U/ml, left panel) or placed in an hypoxia chamber (11% oxygen, right panel). Spleen was harvested at the indicated time points. Cell-surface CD71 was measured using flow-cytometry in EryA. Data points are MFI ± sem for three to six mice per time point, expressed as relative fluorescence units. (B) A dose/response curve in vivo of CD71 up-regulation in response to stress levels of Epo. Balb/C mice were injected with a single subcutaneous Epo dose as indicated. Spleen was harvested at t = 24 h post-injection, and EryA CD71 was measured by flow cytometry. Data points are MFI ± sem of three to eight mice per Epo dose, pooled from two independent experiments, and expressed relative to CD71 levels at t = 0. Bone-marrow EryA CD71 increased similarly. (C–E) EpoR-HM mice fail to up-regulate CD71 and to increase erythropoietic rate in response to stress levels of Epo. Adult EpoR-HM mice or strain-matched wild-type mice were injected with a single Epo dose (100 U/25 g mouse) or with saline control. Cell surface CD71 (C, D) and hematocrit (E) were measured at the indicated time points. (C) Representative CD71 flow-cytometry histograms of spleen EryA, in either wild-type (WT) or EpoR-HM (HM) mice, injected with either saline or Epo, at 24 h post-injection. Two mice are shown for each condition. (D) Summary of data measured as in (C), for HM and WT mice injected with either Epo or saline, at 18 and 24 h post-injection. Each datapoint represents CD71 levels (MFI) in spleen EryA from a single mouse. Two to five mice are shown per time point/genotype combination. (E) Hematocrit response to Epo injection. The hematocrit increases in the wild-type, but not in the EpoR-HM mouse. (F) Rescue of stress-induced CD71 up-regulation in EpoR-HM fetal liver cells after rescue of high-intensity graded p-Stat5 signaling by transduction with high levels of FLAG-Stat5. EpoR-HM or wild-type fetal liver erythroblasts were transduced with either FLAG-Stat5 or FLAG-Stat5Y694, as described in Figure 5A. Cells were incubated overnight in the presence of stress-levels of Epo (0.2 U/ml; this is 6- to 10-fold the Epo basal levels), and were then labeled and analyzed for CD71, Ter119, and FLAG expression by flow-cytometry. Datapoints are CD71 (MFI ± sem) for each FLAG vertical gate, as illustrated in Figure 5B, following correction for background fluorescence by subtracting the corresponding fluorescence for each FLAG gate of samples transduced with FLAG-Stat5Y694F.
Figure 8
Figure 8. Dimmer-switch model of Stat5 signaling.
(A) The operation of a dimmer switch combines binary and graded components. The closing of an “on/off” switch closes an electric circuit, allowing current to flow and switches on a dim light. A gradual further turning of the power-switch dial permits a gradual decrease of the circuit's resistance, with a consequent graded increase in the electric current and light intensity. (B) The p-Stat5 signal is turned “on” through a binary action, to produce a low-intensity but decisive signal in S3 erythroblasts or in EpoR-HM erythroblasts. In S1 early erythroblasts, this signal can increase further with a gradual further increase in Epo concentration. No further increase takes place in mature S3 erythroblasts, though the number of signaling erythroblasts increases with increasing Epo.

Comment in

Similar articles

Cited by

References

    1. D'Andrea AD, Lodish HF, Wong GG (1989) Expression cloning of the murine erythropoietin receptor. Cell 57: 277–285. - PubMed
    1. Wu H, Liu X, Jaenisch R, Lodish HF (1995) Generation of committed erythroid BFU-E and CFU-E progenitors does not require erythropoietin or the erythropoietin receptor. Cell 83: 59–67. - PubMed
    1. Zang H, Sato K, Nakajima H, McKay C, Ney PA, et al. (2001) The distal region and receptor tyrosines of the Epo receptor are non-essential for in vivo erythropoiesis. Embo J 20: 3156–3166. - PMC - PubMed
    1. Koulnis M, Liu Y, Hallstrom K, Socolovsky M (2011) Negative autoregulation by Fas stabilizes adult erythropoiesis and accelerates its stress response. PLoS One 6: e21192 doi:10.1371/journal.pone.0021192. - DOI - PMC - PubMed
    1. Koulnis M, Porpiglia E, Porpiglia PA, Liu Y, Hallstrom K, et al. (2012) Contrasting dynamic responses in vivo of the Bcl-xL and Bim erythropoietic survival pathways. Blood 119: 1228–1239. - PMC - PubMed

Publication types

MeSH terms