. 2012 Sep;8(9):e1002902.
doi: 10.1371/journal.ppat.1002902. Epub 2012 Sep 6.

BZLF1 governs CpG-methylated chromatin of Epstein-Barr Virus reversing epigenetic repression

Affiliations

BZLF1 governs CpG-methylated chromatin of Epstein-Barr Virus reversing epigenetic repression

Anne Woellmer et al. PLoS Pathog. 2012 Sep.

Abstract

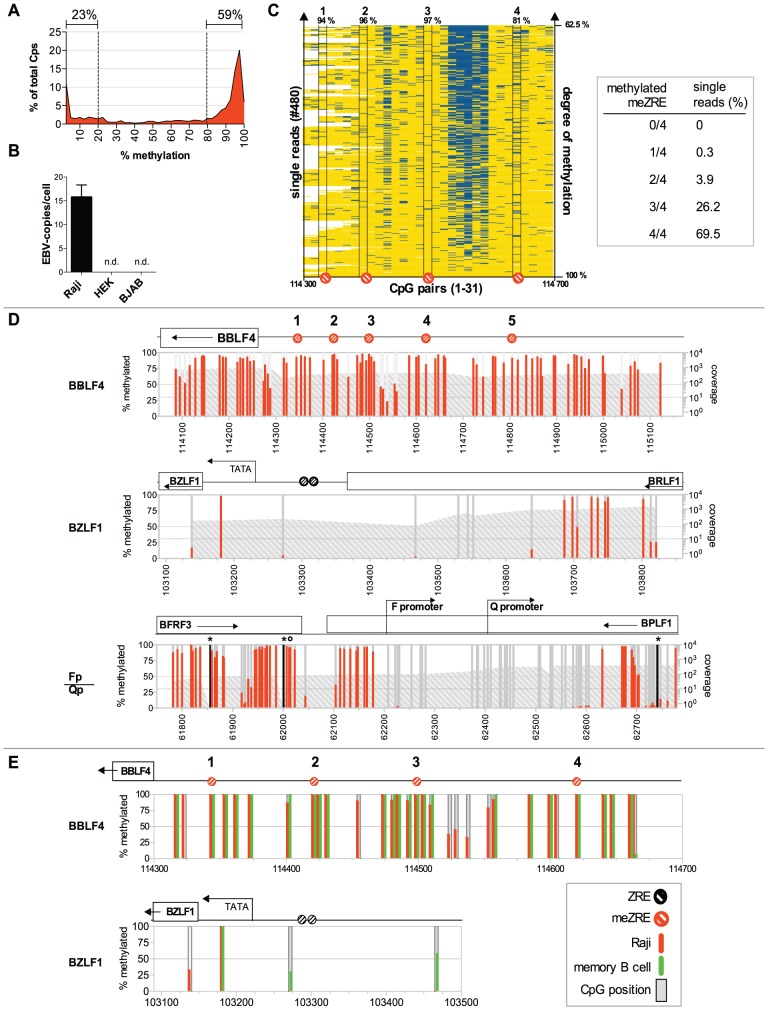
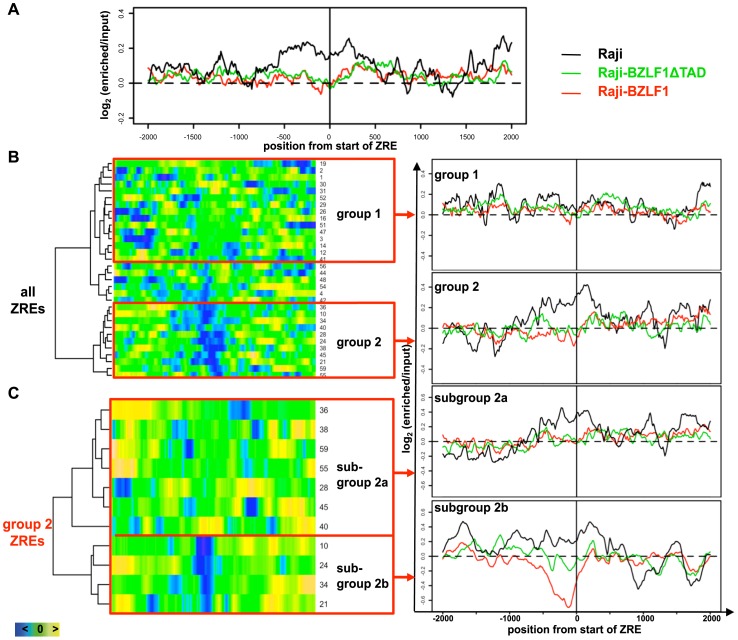
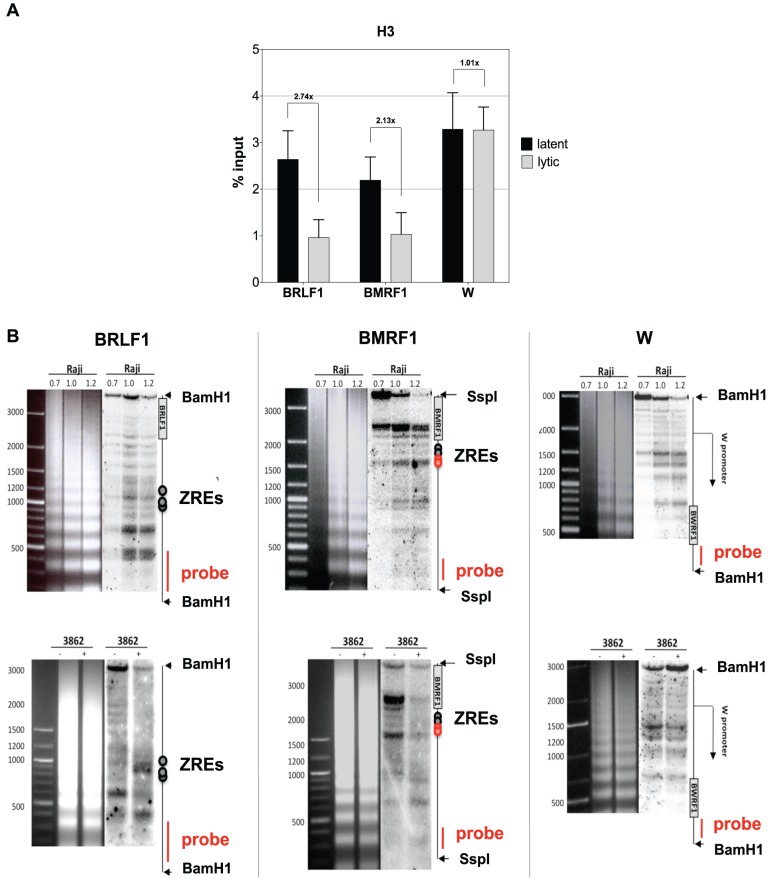
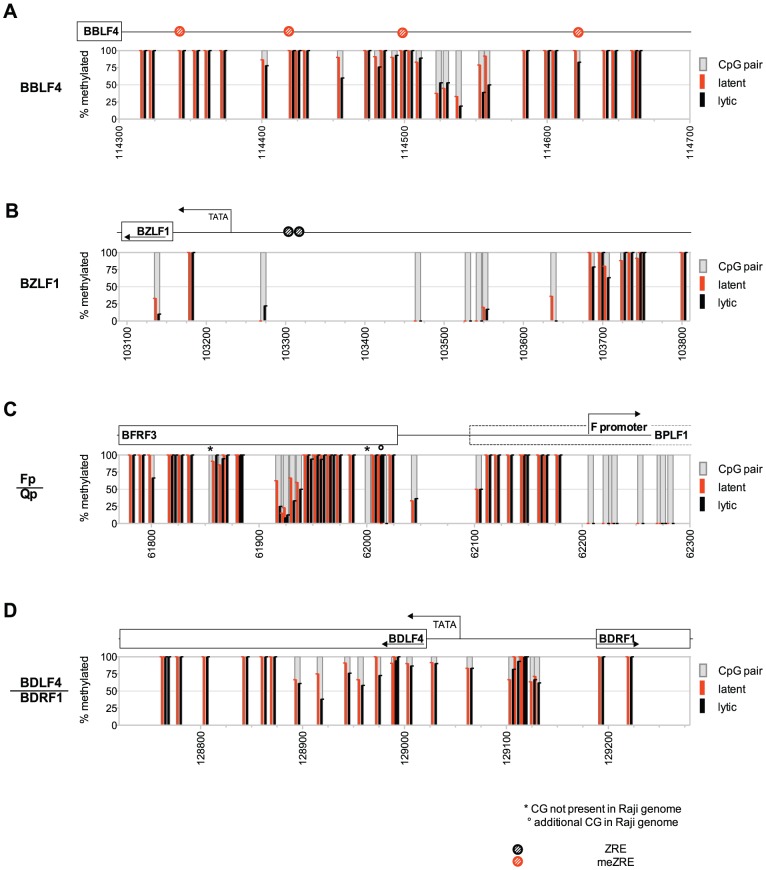
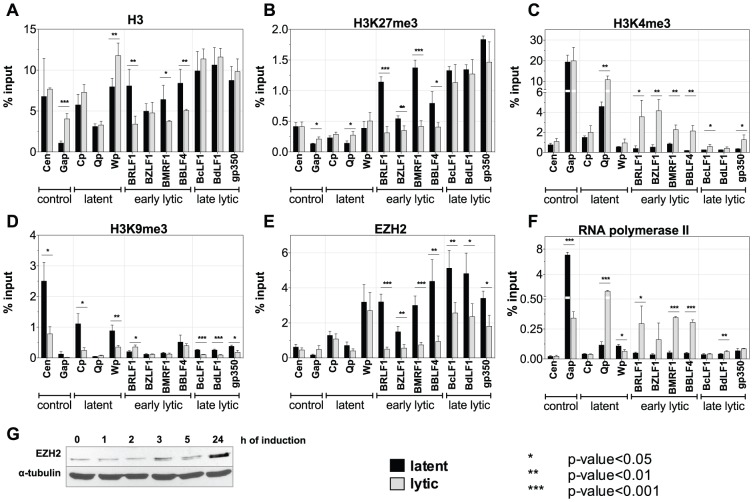
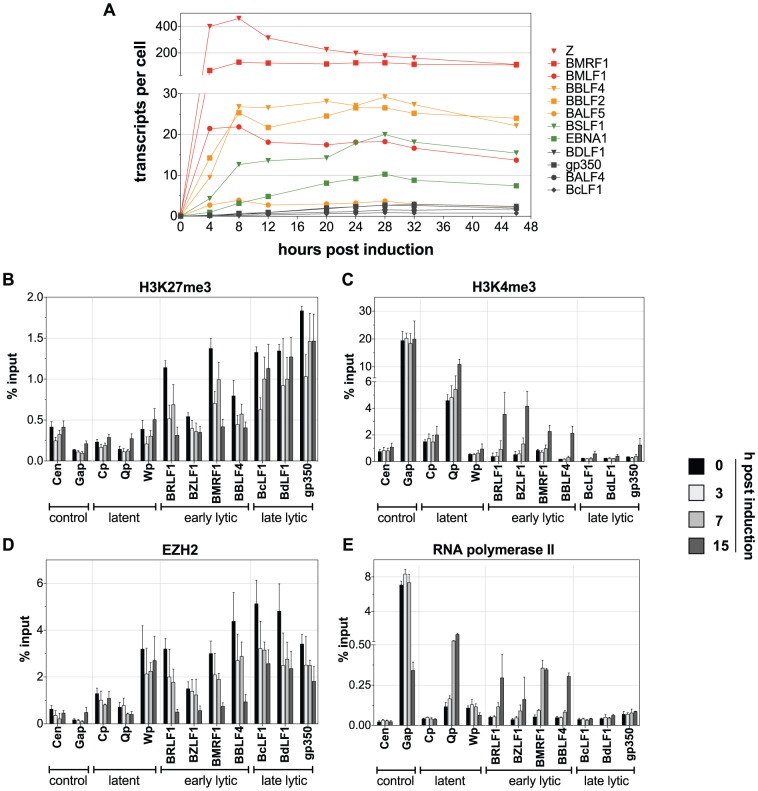
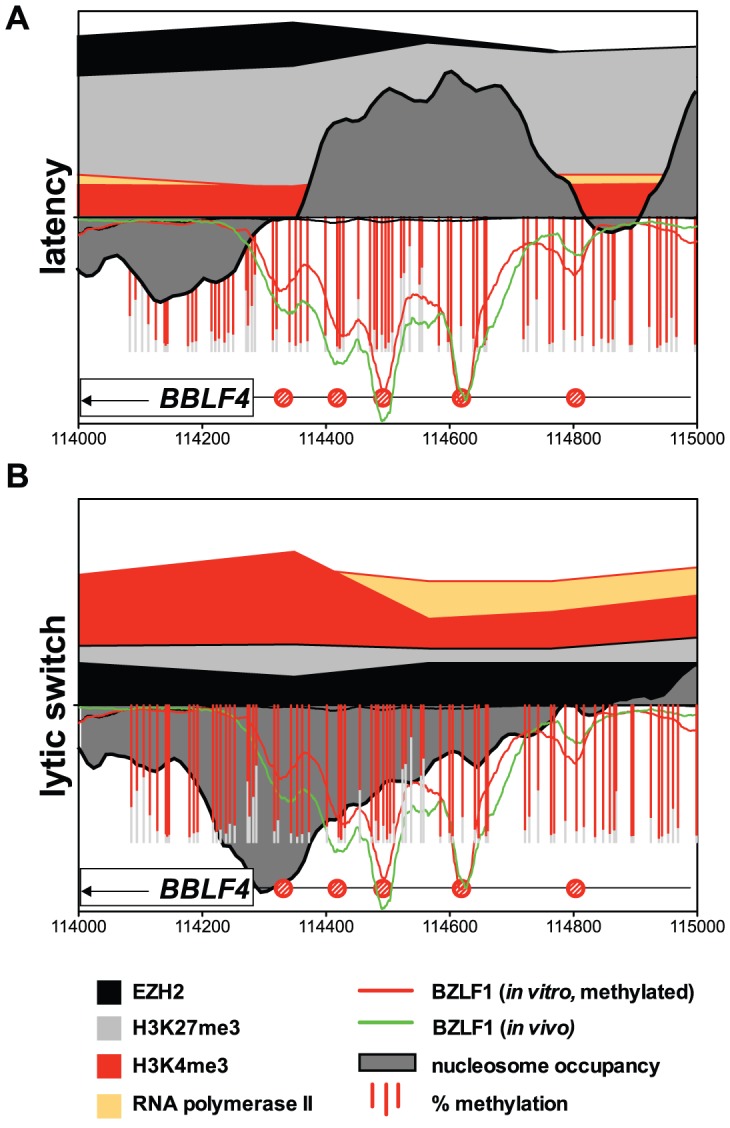
Epigenetic mechanisms are essential for the regulation of all genes in mammalian cells but transcriptional repression including DNA methylation are also major epigenetic mechanisms of defense inactivating potentially harmful pathogens. Epstein-Barr Virus (EBV), however, has evolved to take advantage of CpG methylated DNA to regulate its own biphasic life cycle. We show here that latent EBV DNA has an extreme composition of methylated CpG dinucleotides with a bimodal distribution of unmethylated or fully methylated DNA at active latent genes or completely repressed lytic promoters, respectively. We find this scenario confirmed in primary EBV-infected memory B cells in vivo. Extensive CpG methylation of EBV's DNA argues for a very restricted gene expression during latency. Above-average nucleosomal occupancy, repressive histone marks, and Polycomb-mediated epigenetic silencing further shield early lytic promoters from activation during latency. The very tight repression of viral lytic genes must be overcome when latent EBV enters its lytic phase and supports de novo virus synthesis in infected cells. The EBV-encoded and AP-1 related transcription factor BZLF1 overturns latency and initiates virus synthesis in latently infected cells. Paradoxically, BZLF1 preferentially binds to CpG-methylated motifs in key viral promoters for their activation. Upon BZLF1 binding, we find nucleosomes removed, Polycomb repression lost, and RNA polymerase II recruited to the activated early promoters promoting efficient lytic viral gene expression. Surprisingly, DNA methylation is maintained throughout this phase of viral reactivation and is no hindrance to active transcription of extensively CpG methylated viral genes as thought previously. Thus, we identify BZLF1 as a pioneer factor that reverses epigenetic silencing of viral DNA to allow escape from latency and report on a new paradigm of gene regulation.


Conflict of interest statement

The authors have declared that no competing interests exist.

Figures

Figure 1
Figure 1. DNA methylation of EBV genomes in Raji cells and ex vivo isolated memory B cells.
(A) Distribution of DNA methylation in Raji cells. (B) Determination of the number of EBV episomes in Raji cells. The absolute copy number of EBV DNA per cellular genome equivalent was determined by quantitative real-time PCR analysis of the BZLF1 locus of EBV and compared with the cytochrome c locus as a cellular standard. Raji cells were determined to contain 16 copies of EBV per cell; HEK293 (HEK) and BJAB cells were used as negative controls. (C) Left panel: The 480 single reads of the deep bisulfite sequencing analysis of the BBLF4 promoter were linearly ordered according to their average degree of CpG methylation. Reads with a high percentage of CpG methylation are at the bottom, reads with a lower percentage of CpG methylation are located at the top of the diagram. Yellow: methylated CpG, blue: unmethylated CpG, white: missing. The four identified meZREs within the BBLF4 promoter are depicted below the diagram with their percentage of methylation shown above. Right panel: The single reads that contained the complete information of all four meZRE sites were analyzed for the co-occurrence of unmethylated meZREs on the same DNA molecule. 69.5% of all reads carried methylated CpGs in all four meZREs (69.5%). There was not a single read, in which all the meZREs were unmethylated. (D) DNA methylation of the lytic promoters BBLF4 and BZLF1 and the latent Qp promoter of EBV. Each bar represents a CpG dinucleotide plotted versus its B95.8 genome coordinate. The percentage of methylation is displayed on the left y-axis and indicated in red. The right logarithmic y-axis provides the sequencing coverage depicted as a grey area. Deep bisulfite sequencing detected single sequence variations between Raji DNA and B95.8 wildtype sequence. CpG dinucleotides missing in the Raji genome but present in B95.8 are indicated as black bars with a star on top, while additional CpG dinucleotides in Raji cells are indicated with a circle on top of the red or grey bar. Selected annotation of the EBV genome can be found above the graphs, with ZREs and meZREs indicated as black or red circles, respectively. The BBLF4 promoter is rich in methylated CpG dinucleotides including all meZREs with high affinity for BZLF1. The BZLF1 and the Qp promoters are mostly unmethylated. (E) Comparison of CpG DNA methylation in Raji cells and memory B cells of one healthy donor at two loci of the EBV genome. The percentage of CpG methylation in Raji cells and ex vivo purified memory B cells is depicted in red and green bars, respectively. PCR fragments were directly sequenced by the Sanger method and the resulting chromatograms were analyzed for the ratio of the height of the cytosine peak to the thymine peak, which reflects the rate of conversion after chemical bisulfite modification.
Figure 2
Figure 2. Nucleosome occupancy in BZLF1-regulated promoters.
(A) Overlay of the average nucleosome occupancy profiles of 32 ZREs (Table S2) in parental Raji cells (black line) and two derivatives. Raji-BZLF1ΔTAD cells (green line) constitutively express a truncated BZLF1 version without its transactivation domain. Raji-BZLF1 cells (red line) express wild-type BZLF1 protein 15 hours after doxycycline induction. The nucleosome occupancy was analyzed in a window of ±2000 bp, centered at the start position of each ZRE. (B) Comparison of the nucleosome occupancy of latent Raji and lytically induced Raji-BZLF1 cells. Left panel: a heat map of 32 single ZREs (Table S2) shows the subtractions of the log2-ratios of lytically induced Raji-BZLF1 cells and latent Raji cells. A dendrogram of the heat map matrix shown on the left side indicated two most divergent groups, group 1 and 2. Right panel: The overlay of the average nucleosomal occupancy for group 1 ZREs and group 2 ZREs were obtained as in (A). (C) Comparison of the nucleosome occupancy of Raji-BZLF1ΔTAD and lytically induced Raji-BZLF1 cells. A second heat map and dendrogram comprises subtractions of the log2-ratios of lytically induced Raji-BZLF1 cells (full length BZLF1) and Raji-BZLF1ΔTAD cells (truncated BZLF1) of the eleven single ZREs of group 2. Subgroup 2a ZREs comprised ZREs of the upper and lower cluster of the dendrogram on the left (see Table 1 for their grouping).
Figure 3
Figure 3. Chromatin Immunoprecipitation and indirect endlabeling experiments confirm the loss of nucleosomes at ZREs.
(A) Chromatin Immunoprecipitation (ChIP) of histone H3. Histone H3-ChIPs confirmed the loss of nucleosomes in two promoters containing ZREs (BRLF1 and BMRF1) in lytically induced cells. In contrast, the ZRE-free latent W promoter was not affected. The results of three independent experiments were averaged. Data are represented as mean +/− SD. (B) Indirect endlabeling experiments confirmed the microarray hybridization and ChIP results. Upper panels: Indirect endlabeling experiments in Raji cells are shown covering three different promoters. Lower panels: The three regions were re-analyzed in uninduced Raji-BZLF1 cells (−) or after induction with 100 ng/ml doxycycline overnight (+). The patterns in uninduced cells were similar to the ones seen in parental Raji cells. Induction of the lytic phase led to rearrangements in the nucleosomal pattern at the ZRE-containing BRLF1 promoter and the BMRF1 promoter but not in the W promoter, which lacks ZREs.
Figure 4
Figure 4. The DNA methylation profile of Raji EBV DNA does not change upon induction of EBV's lytic phase.
DNA of Raji cells or Raji-BZLF1 cells, which had been induced with doxycycline for 15 hours and sorted for expression of GFP, were treated with bisulfite and amplified with primers specific for (A) the early lytic BBLF4 promoter, (B) the immediate early BZLF1 promoter, (C) the latent Qp/Fp promoter, and (D) the late lytic BDLF4/BDRF1 promoter. PCR fragments were directly sequenced by the Sanger method as in Fig. 1E. The percentage of CpG methylation in Raji cells (latent) is depicted in red; the percentage of methylation in lytically induced Raji-BZLF1 cells (lytic) is indicated as black bars.
Figure 5
Figure 5. Chromatin state of Raji cells in the latent and the lytic phase.
Three independent sets of chromatin immunoprecipitations (ChIPs) followed by quantitative PCR analysis of latent, early lytic, late lytic viral promoters, and cellular control loci are shown. Black bars represent uninduced, latent Raji-BZLF1 cells; grey bars represent lytically induced cells after treatment with doxycycline for 15 h. Data are represented as mean +/− SD. Asterisks indicate the p-value of each data point (*** p-value<0.001, ** p-value<0.01, * p-value<0.05). (A) histone H3; (B) repressive H3K27me3 histone modification; (C) activating H3K4me3 histone modification; (D) repressive H3K9me3 histone modification; (E) histone methyltransferase EZH2; (F) PolII ; (G) Western blot immunodetection of EZH2.
Figure 6
Figure 6. Kinetics of promoter activation after induction of EBV's lytic phase.
(A) Evaluation of lytic transcript levels by quantitative RT-PCR. Raji-BZLF1 cells were induced with 100 ng/ml doxycycline for 46 h. A fraction of the cells was harvested every four hours. The temporal induction of different EBV genes suggests four different functional groups of viral genes. Group 1 (red) responds within four hours to the addition of doxycycline and encompasses BZLF1 (Z), BMRF1, and BMLF1. Group 2 (orange) consists of BBLF4, BBLF2, and BALF5. They reached the expression peak eight hours post induction. EBNA1 and BSLF1 levels increased slowly over time (group 3, green) peaking at 28 hours after induction, while the late lytic genes (group 4, grey) showed no or only a very low expression upon lytic induction with kinetics comparable to group 3. (B–E) Chromatin immunoprecipitation experiments of Raji-BZLF1 cells upon lytic stimulation determined the occupancy of histones and their posttranslational modifications and the proteins EZH2 and RNA polymerase II in time course experiments. The experiments were conducted as described in Fig. 5. The loss of the repressive chromatin mark H3K27me3 and of the H3K27me3 methyltransferase EZH2 could already be detected after three hours post induction with doxycycline (B, D). The increase of the activation mark H3K4me3 was only visible 15 hours post induction (C) Binding of RNA polymerase II to early lytic promoters could be detected after 15 hours, but the very early responder BMRF1 was occupied by the protein already 7 hours post induction in line with the RT-PCR analysis, which identified this gene to be quickly induced upon lytic stimulation (E).
Figure 7
Figure 7. Epigenetic regulation of EBV: Close-up of the BBLF4 promoter.
On the lower half of the y-axis the binding profile of BZLF1 in vivo is shown as a green line, it's binding to methylated DNA in vitro as a red line. Red bars indicate the extent of CpG methylation (Fig. 1D). The dark grey area indicates relative nucleosomal occupancy. On the upper half of the y-axis, the black area indicates EZH2, the light grey area H3K27me3, the red area H3K4me3, and the orange area PolII. Results are provided as relative, dimensionless numbers; their scaling is identical in both graphs. (A) Repressive modifications characterize the BBLF4 promoter during latency. (B) A hypersensitive site becomes established at meZREs immediately upstream of the coding sequence of BBLF4 (grey area). H3K27me3 and EZH2 are lost and H3K4me3 and PolII indicate active transcription.

Similar articles

Cited by

References

    1. Stamatoyannopoulos G (2005) Control of globin gene expression during development and erythroid differentiation. Exp Hematol 33: 259–271. - PMC - PubMed
    1. Singal R, Ginder GD (1999) DNA methylation. Blood 93: 4059–4070. - PubMed
    1. Kangaspeska S, Stride B, Metivier R, Polycarpou-Schwarz M, Ibberson D, et al. (2008) Transient cyclical methylation of promoter DNA. Nature 452: 112–115. - PubMed
    1. Metivier R, Gallais R, Tiffoche C, Le Peron C, Jurkowska RZ, et al. (2008) Cyclical DNA methylation of a transcriptionally active promoter. Nature 452: 45–50. - PubMed
    1. Reid G, Gallais R, Metivier R (2009) Marking time: the dynamic role of chromatin and covalent modification in transcription. Int J Biochem Cell Biol 41: 155–163. - PubMed

Publication types

MeSH terms