

Normal DNA methylation dynamics in DICER1-deficient mouse embryonic stem cells
- PMID: 22969435
- PMCID: PMC3435250
- DOI: 10.1371/journal.pgen.1002919
Normal DNA methylation dynamics in DICER1-deficient mouse embryonic stem cells
Abstract
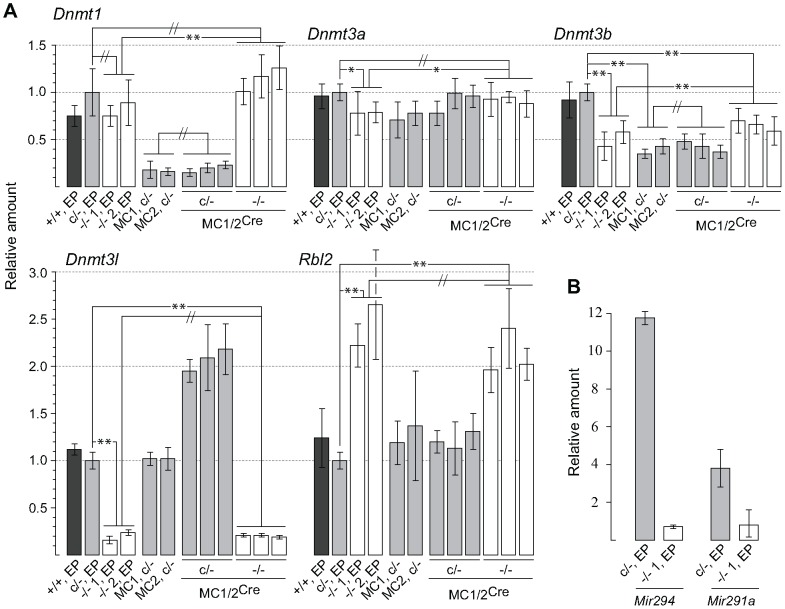
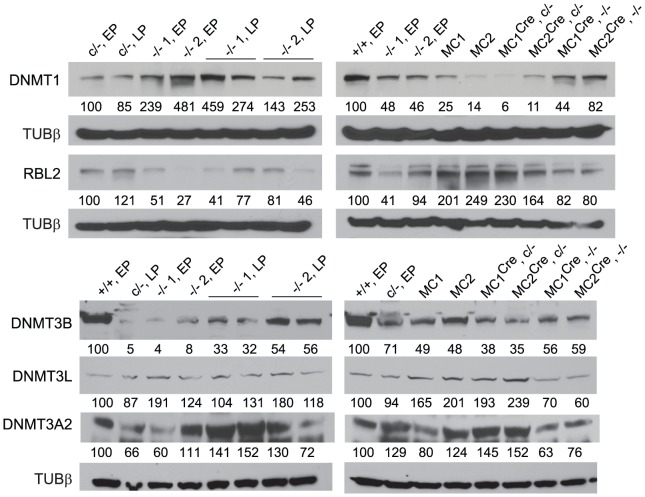
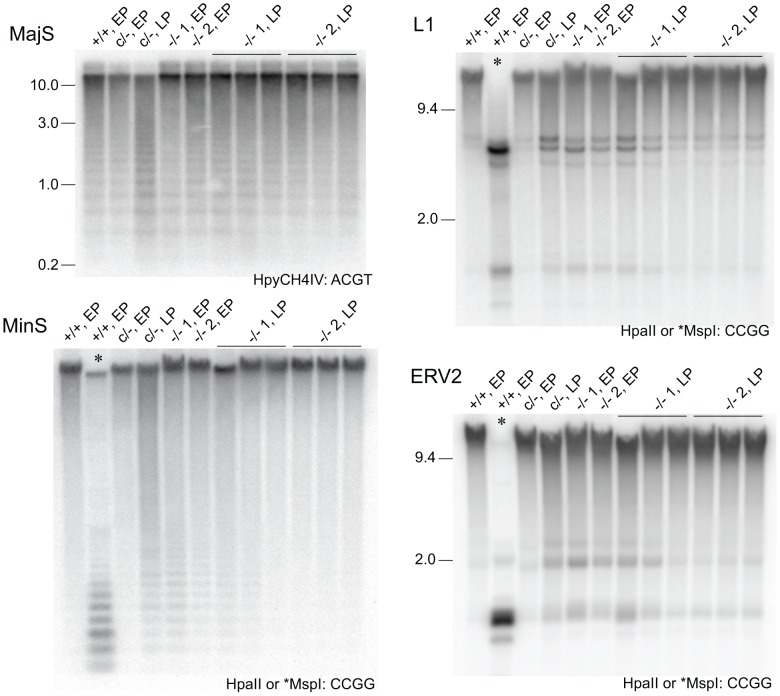
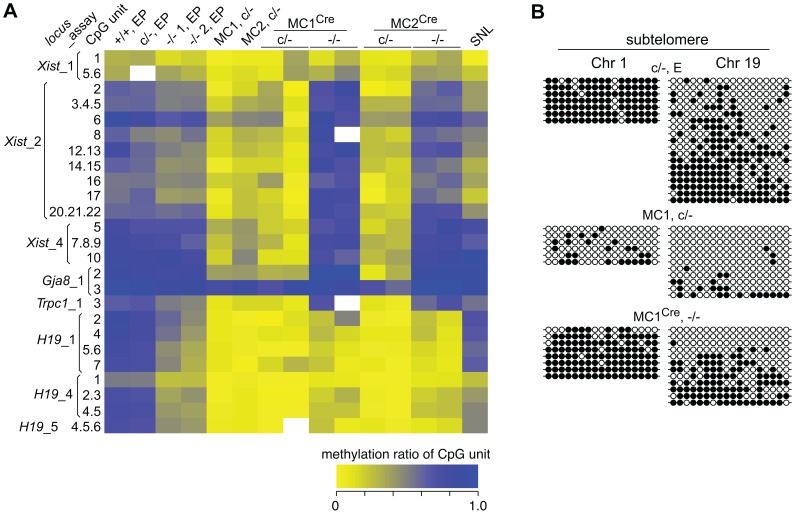
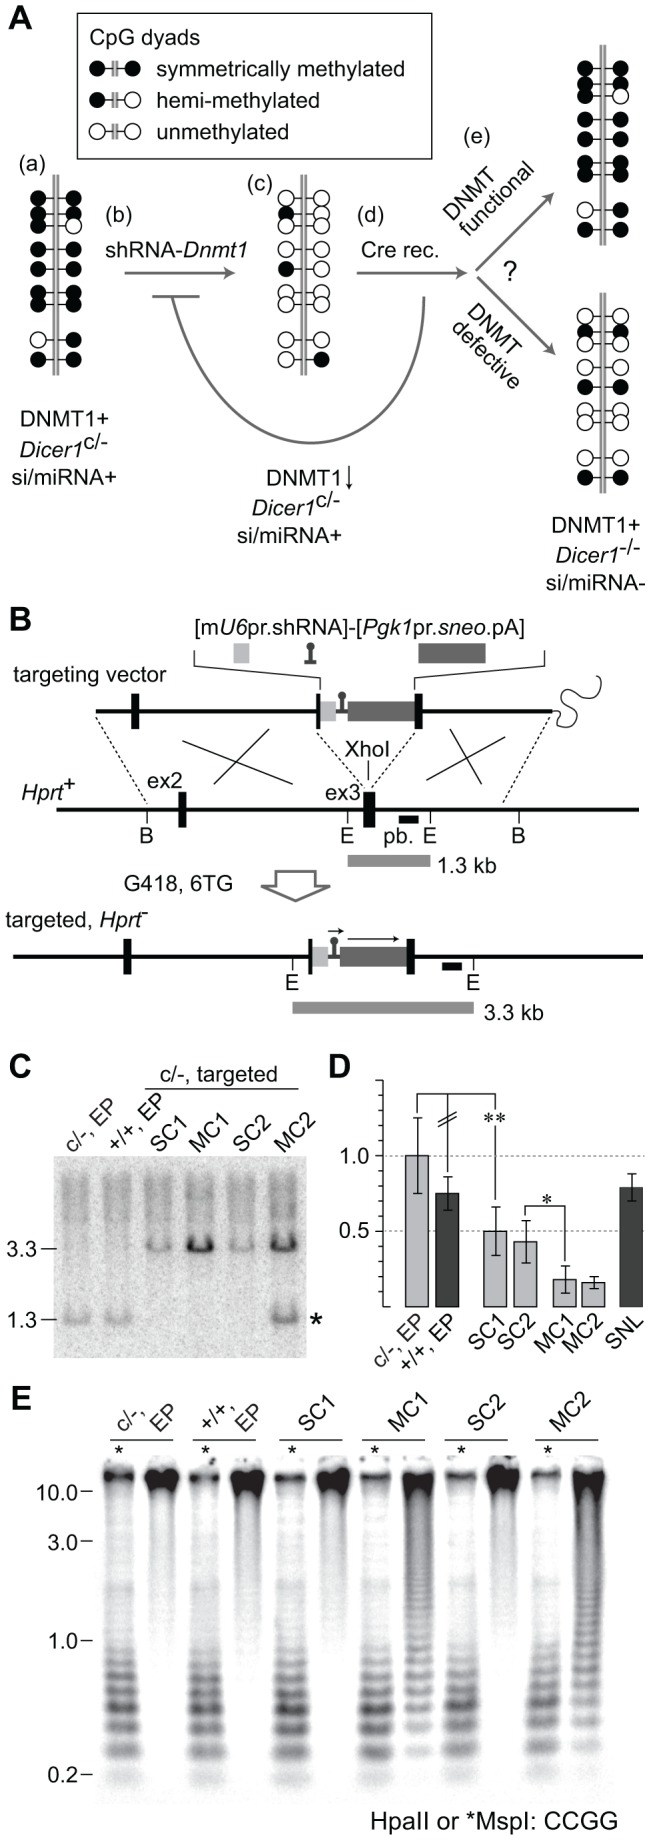
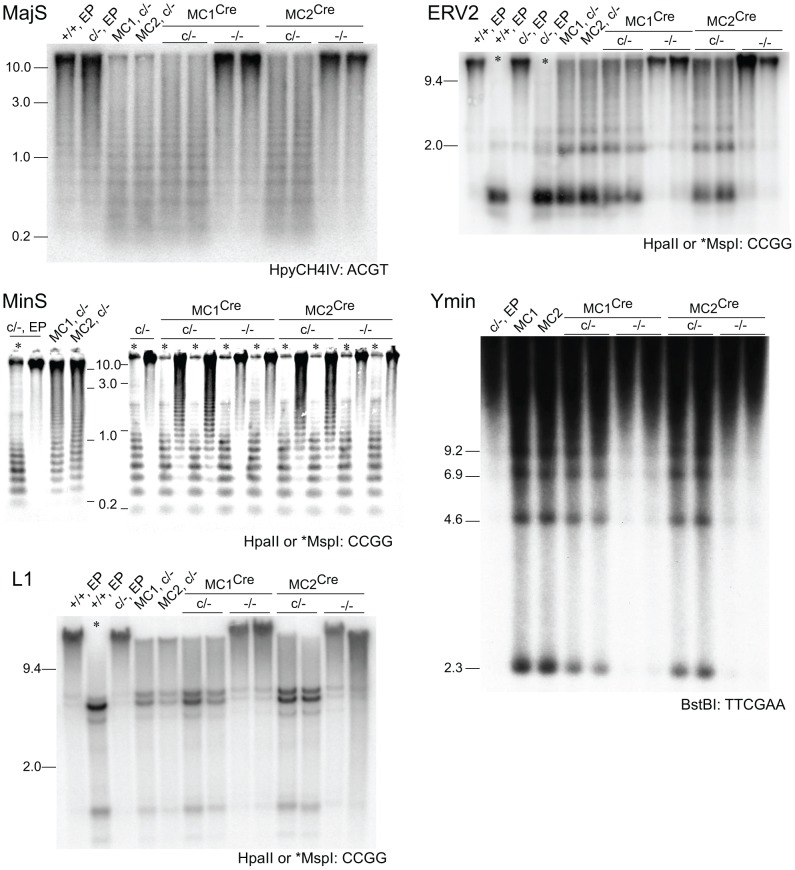
Reduced DNA methylation has been reported in DICER1-deficient mouse ES cells. Reductions seen at pericentric satellite repeats have suggested that siRNAs are required for the proper assembly of heterochromatin. More recent studies have postulated that the reduced methylation is an indirect effect: the loss of Mir290 cluster miRNAs leads to upregulation of the transcriptional repressor RBL2 that targets the downregulation of DNA methyltransferase (Dnmt) genes. However, the observations have been inconsistent. We surmised that the inconsistency could be related to cell line "age," given that DNA methylation is lost progressively with passage in DNMT-deficient ES cells. We therefore subjected Dicer1(-/-) ES cells to two experimental regimes to rigorously test the level of functional DNMT activity. First, we cultured them for a prolonged period. If DNMT activity was reduced, further losses of methylation would occur. Second, we measured their DNMT activity in a rebound DNA methylation assay: DNA methylation was stripped from Cre/loxP conditionally mutant Dicer1 ES cells using a shRNA targeting Dnmt1 mRNA. Cre expression then converted these cells to Dicer1(-/-), allowing for DNMT1 recovery and forcing the cells to remethylate in the absence of RNAi. In both cases, we found functional DNMT activity to be normal. Finally, we also show that the level of RBL2 protein is not at excess levels in Dicer1(-/-) ES cells as has been assumed. These studies reveal that reduced functional DNMT activity is not a salient feature of DICER1-deficient ES cells. We suggest that the reduced DNA methylation sometimes observed in these cells could be due to stochastic alterations in DNA methylation patterns that could offer growth or survival advantages in culture, or to the dysregulation of pathways acting in opposition to the DNMT pathway.
Conflict of interest statement
The authors have declared that no competing interests exist.
Figures
Similar articles
-
A mammalian microRNA cluster controls DNA methylation and telomere recombination via Rbl2-dependent regulation of DNA methyltransferases.Nat Struct Mol Biol. 2008 Mar;15(3):268-79. doi: 10.1038/nsmb.1399. Epub 2008 Mar 2. Nat Struct Mol Biol. 2008. PMID: 18311151 Free PMC article.
-
MicroRNAs control de novo DNA methylation through regulation of transcriptional repressors in mouse embryonic stem cells.Nat Struct Mol Biol. 2008 Mar;15(3):259-67. doi: 10.1038/nsmb.1391. Epub 2008 Mar 2. Nat Struct Mol Biol. 2008. PMID: 18311153
-
A novel requirement for DROSHA in maintenance of mammalian CG methylation.Nucleic Acids Res. 2017 Sep 19;45(16):9398-9412. doi: 10.1093/nar/gkx695. Nucleic Acids Res. 2017. PMID: 28934503 Free PMC article.
-
RNA interference in mammalian DNA methylation.Biochem Cell Biol. 2012 Feb;90(1):70-7. doi: 10.1139/o11-050. Epub 2011 Oct 17. Biochem Cell Biol. 2012. PMID: 22003849 Review.
-
The Role of DNA Methylation in Stroke Recovery.Int J Mol Sci. 2022 Sep 8;23(18):10373. doi: 10.3390/ijms231810373. Int J Mol Sci. 2022. PMID: 36142283 Free PMC article. Review.
Cited by
-
RBL2 bi-allelic truncating variants cause severe motor and cognitive impairment without evidence for abnormalities in DNA methylation or telomeric function.J Hum Genet. 2021 Nov;66(11):1101-1112. doi: 10.1038/s10038-021-00931-z. Epub 2021 May 13. J Hum Genet. 2021. PMID: 33980986
-
Dicer interacts with SIRT7 and regulates H3K18 deacetylation in response to DNA damaging agents.Nucleic Acids Res. 2016 May 5;44(8):3629-42. doi: 10.1093/nar/gkv1504. Epub 2015 Dec 23. Nucleic Acids Res. 2016. PMID: 26704979 Free PMC article.
-
RNAi-dependent and independent control of LINE1 accumulation and mobility in mouse embryonic stem cells.PLoS Genet. 2013 Nov;9(11):e1003791. doi: 10.1371/journal.pgen.1003791. Epub 2013 Nov 7. PLoS Genet. 2013. Retraction in: PLoS Genet. 2015 Sep 03;11(9):e1005519. doi: 10.1371/journal.pgen.1005519. PMID: 24244175 Free PMC article. Retracted.
-
MicroRNAs of the miR-290-295 Family Maintain Bivalency in Mouse Embryonic Stem Cells.Stem Cell Reports. 2016 May 10;6(5):635-642. doi: 10.1016/j.stemcr.2016.03.005. Epub 2016 Apr 14. Stem Cell Reports. 2016. PMID: 27150236 Free PMC article.
-
Inhibition of a K9/K36 demethylase by an H3.3 point mutation found in paediatric glioblastoma.Nat Commun. 2018 Aug 7;9(1):3142. doi: 10.1038/s41467-018-05607-5. Nat Commun. 2018. PMID: 30087349 Free PMC article.
References
-
- Peters AH, O'Carroll D, Scherthan H, Mechtler K, Sauer S, et al. (2001) Loss of the Suv39h histone methyltransferases impairs mammalian heterochromatin and genome stability. Cell 107: 323–337. - PubMed
-
- Lehnertz B, Ueda Y, Derijck AA, Braunschweig U, Perez-Burgos L, et al. (2003) Suv39h-mediated histone H3 lysine 9 methylation directs DNA methylation to major satellite repeats at pericentric heterochromatin. Curr Biol 13: 1192–1200. - PubMed
-
- Yoder JA, Walsh CP, Bestor TH (1997) Cytosine methylation and the ecology of intragenomic parasites. Trends Genet 13: 335–340. - PubMed
-
- Walsh CP, Chaillet JR, Bestor TH (1998) Transcription of IAP endogenous retroviruses is constrained by cytosine methylation. Nat Genet 20: 116–117. - PubMed
Publication types
MeSH terms
Substances
LinkOut - more resources
Full Text Sources
Molecular Biology Databases
