. 2012 Aug 30:6:124.
doi: 10.3389/fnins.2012.00124. eCollection 2012.

Btg1 is Required to Maintain the Pool of Stem and Progenitor Cells of the Dentate Gyrus and Subventricular Zone

Affiliations

Btg1 is Required to Maintain the Pool of Stem and Progenitor Cells of the Dentate Gyrus and Subventricular Zone

Stefano Farioli-Vecchioli et al. Front Neurosci. .

Abstract

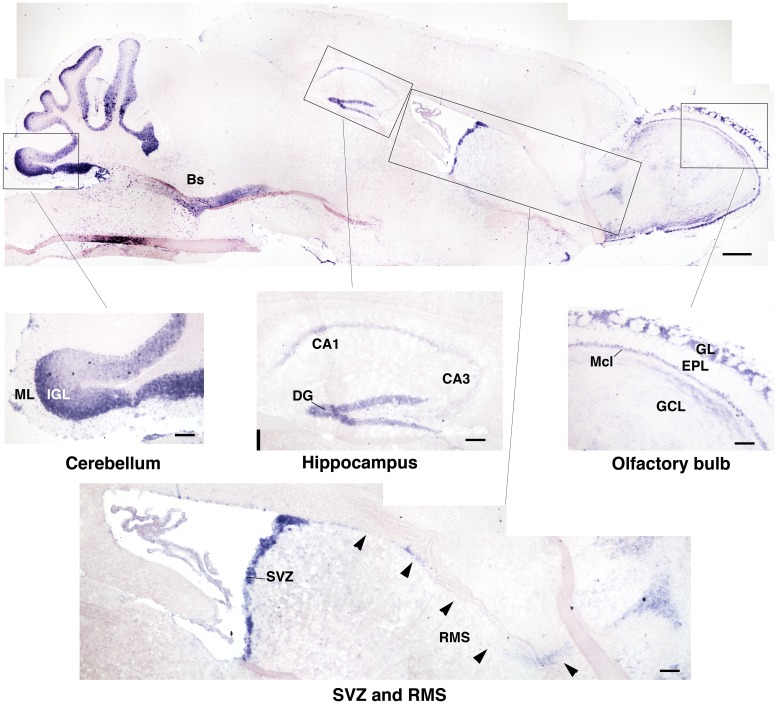
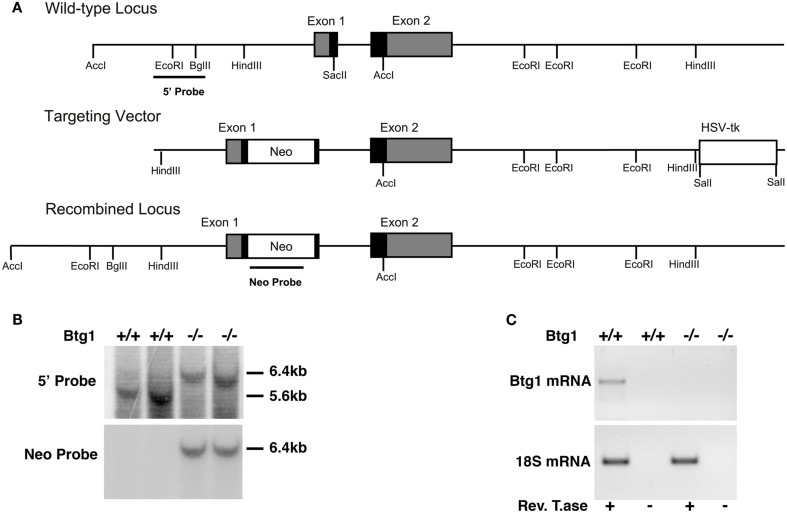
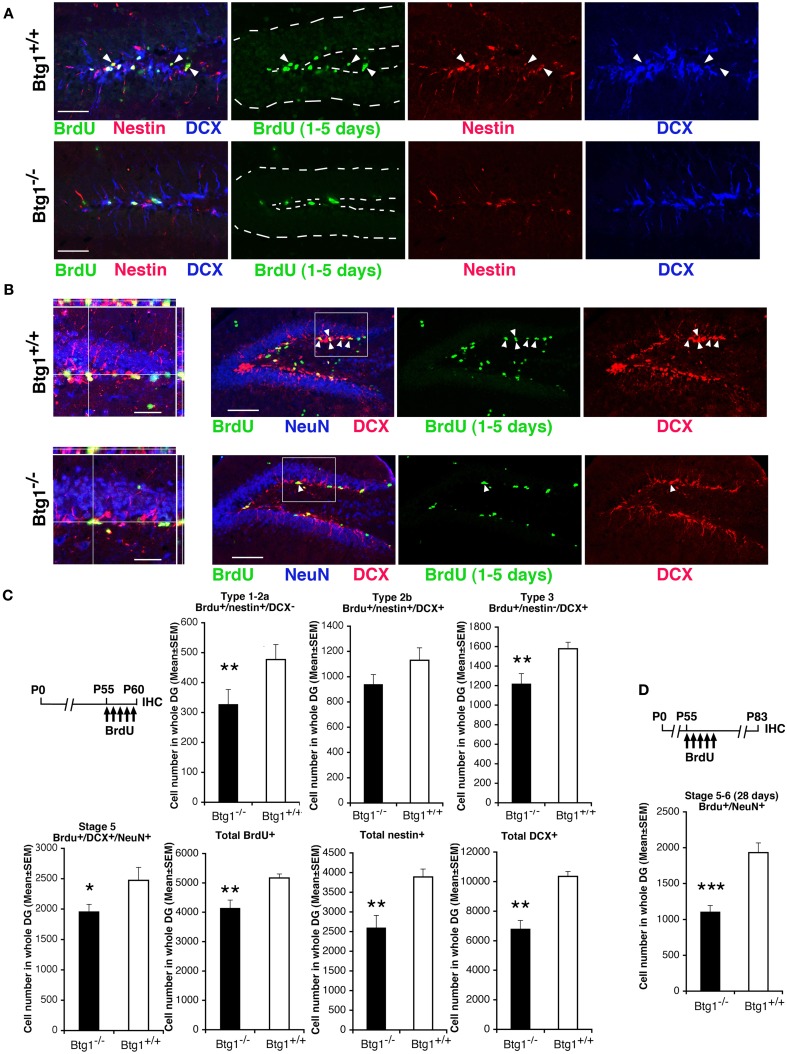
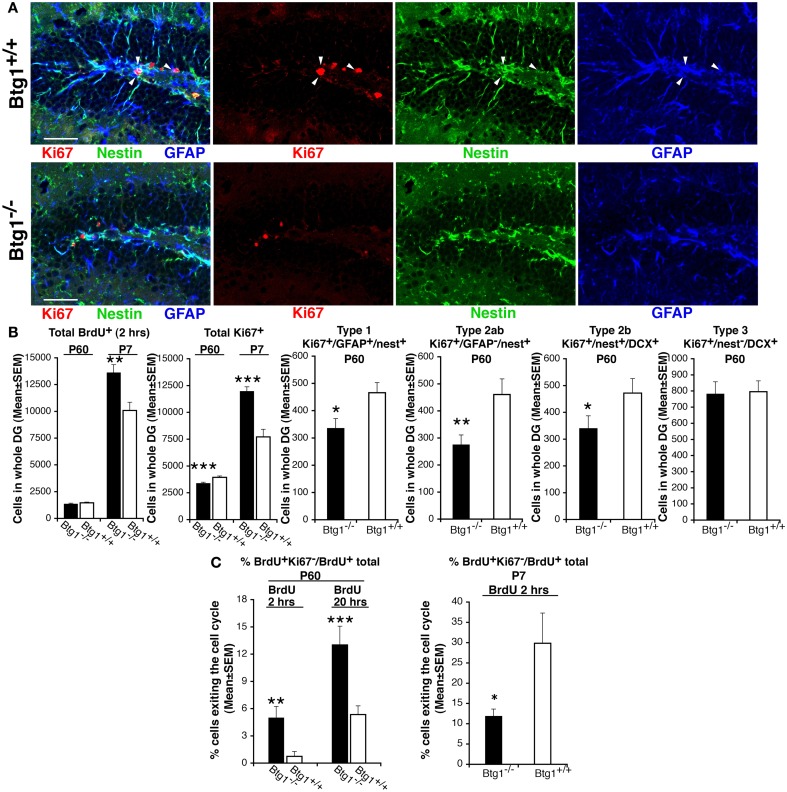
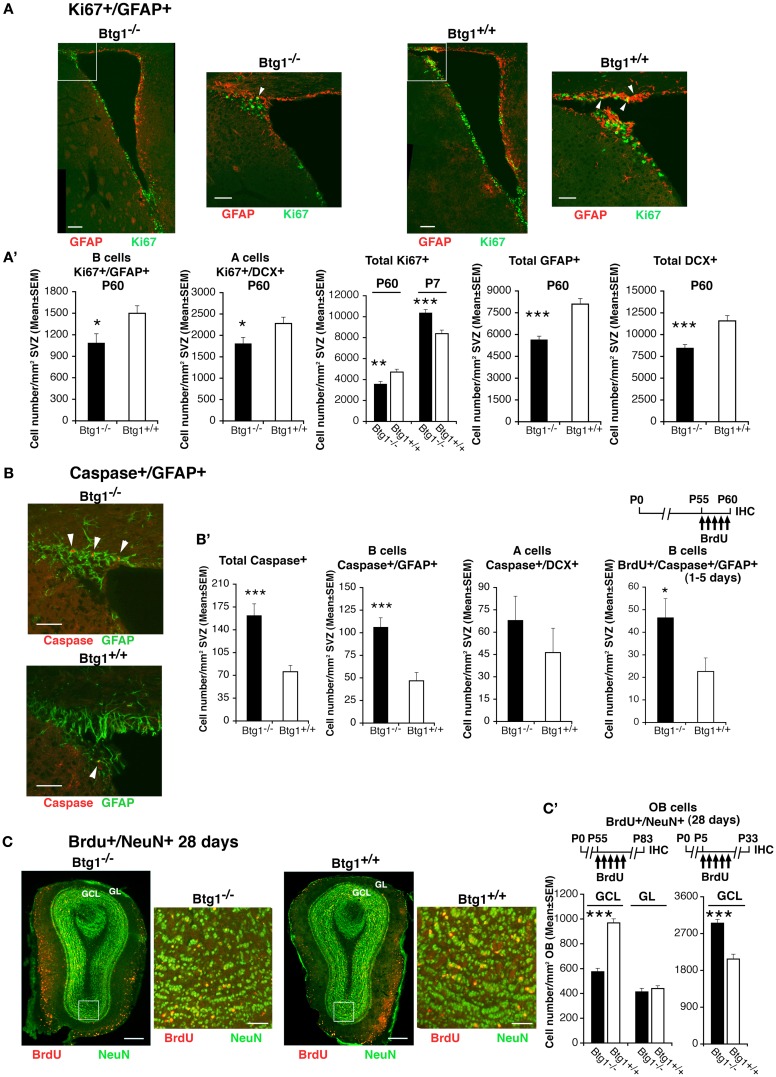
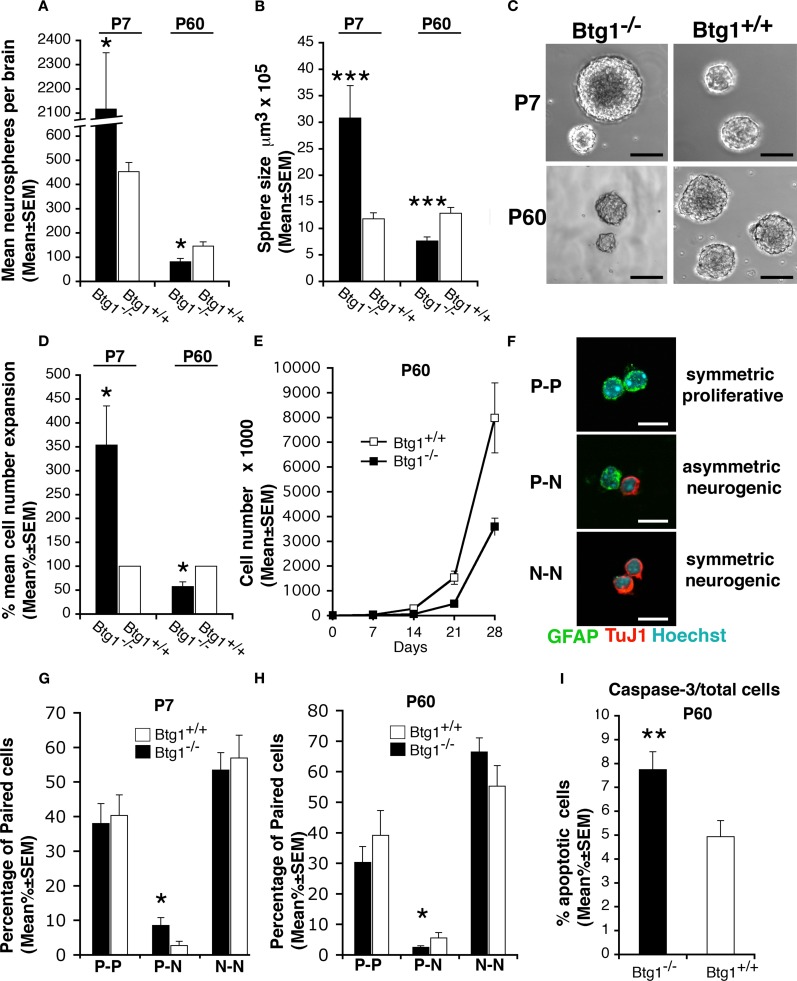
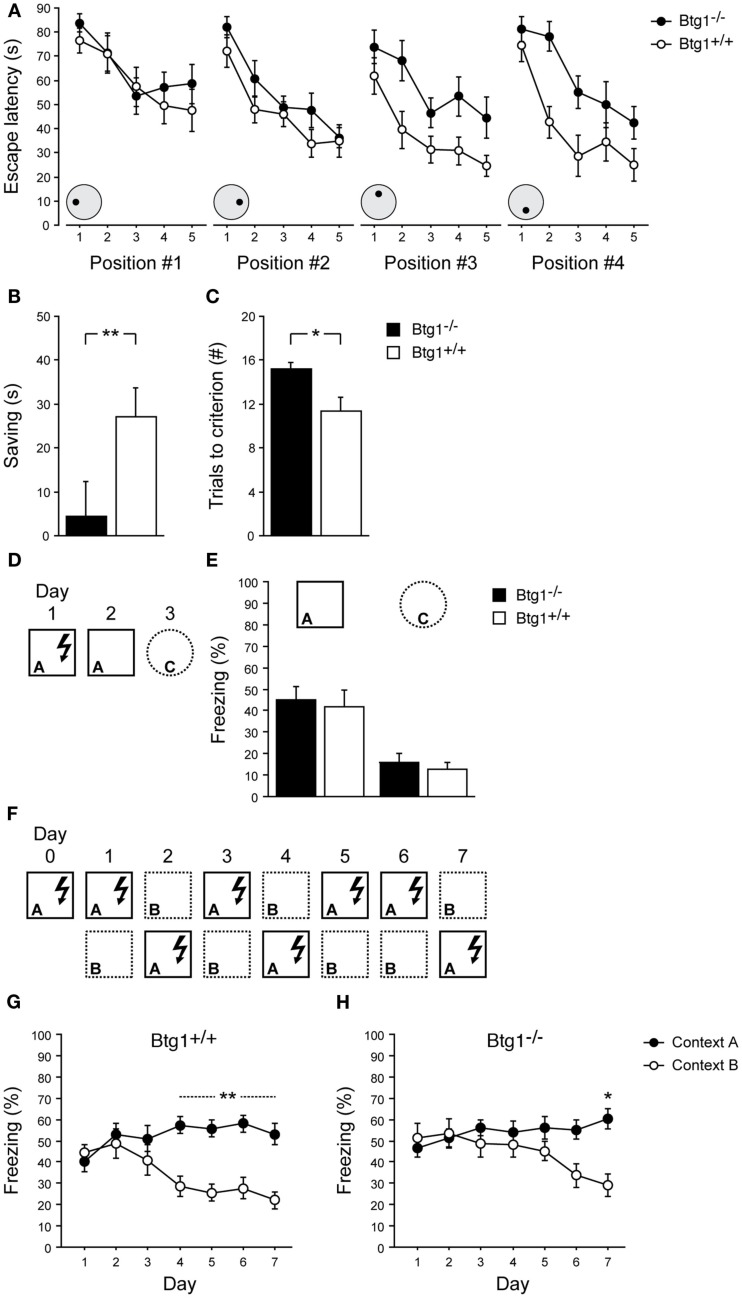
Btg1 belongs to a family of cell cycle inhibitory genes. We observed that Btg1 is highly expressed in adult neurogenic niches, i.e., the dentate gyrus and subventricular zone (SVZ). Thus, we generated Btg1 knockout mice to analyze the role of Btg1 in the process of generation of adult new neurons. Ablation of Btg1 causes a transient increase of the proliferating dentate gyrus stem and progenitor cells at post-natal day 7; however, at 2 months of age the number of these proliferating cells, as well as of mature neurons, greatly decreases compared to wild-type controls. Remarkably, adult dentate gyrus stem and progenitor cells of Btg1-null mice exit the cell cycle after completing the S phase, express p53 and p21 at high levels and undergo apoptosis within 5 days. In the SVZ of adult (two-month-old) Btg1-null mice we observed an equivalent decrease, associated to apoptosis, of stem cells, neuroblasts, and neurons; furthermore, neurospheres derived from SVZ stem cells showed an age-dependent decrease of the self-renewal and expansion capacity. We conclude that ablation of Btg1 reduces the pool of dividing adult stem and progenitor cells in the dentate gyrus and SVZ by decreasing their proliferative capacity and inducing apoptosis, probably reflecting impairment of the control of the cell cycle transition from G1 to S phase. As a result, the ability of Btg1-null mice to discriminate among overlapping contextual memories was affected. Btg1 appears, therefore, to be required for maintaining adult stem and progenitor cells quiescence and self-renewal.

Keywords: BTG family; differentiation; knock out mice; learning and memory; neural stem cells; neurogenic niches; proliferation.


Figures

Figure 1
Figure 1
Expression of Btg1 in the mouse adult brain. A representative sagittal section of the brain from a 2-month-old mice, showing the expression of Btg1 mRNA labeled by in situ hybridization. Btg1 mRNA is clearly detectable (see enlargements of boxed areas): (i) in all neurons within the cell layers in the dentate gyrus blades of the hippocampus (DG) and to a lower extent in CA3 and CA1; (ii) in the subventricular zone (SVZ) and in neurons migrating from it along the rostral migratory stream (RMS); (iii) in the olfactory bulb in the glomerular layer (GL) and in the mitral cell layer (Mcl), while it is present to a lower level in the granule cell layer (GCL) and is absent in the external plexiform layer (EPL); (iv) in the cerebellum, in the molecular layer (ML) and the internal granular layer (IGL); (v) in the brainstem (Bs; upper panel). Scale bars: 500 μm (panel above) or 100 μm (enlargements).
Figure 2
Figure 2
Mouse Btg1 targeting in ES cells and generation of Btg1−/− mice. (A) Genomic organization and disruption strategy of the mouse Btg1 gene; the gene, the targeting construct, and the recombined mouse Btg1 allele are shown. Gray or black boxes: untranslated or translated regions, respectively. (B) Genomic Southern blot analysis of genomic DNA from wild-type and Btg1−/− mice, digested with AccI and hybridized to the 5′ and Neo probes. (C) Semiquantitative RT-PCR analysis of Btg1 mRNA extracted from SVZ neurospheres of P60 mice with different Btg1 genotypes. Equal amounts of RT-PCR products, amplified in the region encompassing part of the first and second Btg1 exon or 18S mRNA were visualized by gel. RT± refers to the products of amplification performed in parallel on aliquots of each RNA sample, preincubated or not with ReverseTranscriptase, as negative controls.
Figure 3
Figure 3
In Btg1-null adult mice the number of new 1- to 5-day-old dentate gyrus progenitor cells and of 28-day-old neurons is reduced. Representative images showing a decrease in the dentate gyrus of Btg1-null mice of (A) new stem and progenitor cells (type-1–2a; BrdU+/nestin+/DCX, marked by green and red and negative to blue, respectively, indicated by white arrowheads; scale bar, 50 μm) and of (B) post-mitotic 1- to 5-day-old neurons (stage 5; BrdU+/DCX+/NeuN+, indicated within the box by white arrowheads; scale bar, 100 μm), as detected by incorporation of BrdU after five daily injections in P60 Btg1+/+ and Btg1−/− mice, and by the specific markers indicated, through multiple-labeling confocal microscopy. (B) On the left: 3D reconstruction from Z-stack of triple- and double-positive cells shown in the boxed area (scale bar, 20 μm). In (A) the dentate gyrus is outlined by a broken line. (C) Scheme of BrdU treatment and quantification of the number of new 1- to 5-day-old type-1–2a (BrdU+/nestin+/DCX), type-2b (BrdU+/nestin+/DCX+), and type-3 (BrdU+/nestin/DCX+) stem and progenitor cell, as well as of stage 5 post-mitotic neurons, indicated a significant decrease (except for type-2b) in P60 Btg1-null mice. Also total BrdU-positive, total nestin-positive and total DCX-positive progenitor cells decreased significantly. (D) However, the highest reduction was observed for 28-day-old terminally differentiated neurons (BrdU+/NeuN+; above the graph is the scheme of treatment of mice with five BrdU injections 28 days before perfusion at P83). Cell numbers in dentate gyrus, shown in (C,D) were measured as described in Materials and Methods and are represented as mean ± SEM of the analysis of three animals per group. *p < 0.05, **p < 0.01, or ***p < 0.001 vs. Btg1+/+ dentate gyrus; Student’s t-test.
Figure 4
Figure 4
In Btg1-null adult mice the number of cycling dentate gyrus progenitor cells decreases, after a transient early post-natal increase. (A) Representative confocal images in P60 dentate gyrus Btg1-null mice showing a decrease of dividing stem cells, identified by means of Ki67 (type-1; Ki67+/nestin+/GFAP+, red, green, and blue, respectively, indicated by white arrowheads; scale bar, 50 μm). (B) The quantification of the total number of dentate gyrus cells entering the S phase (total BrdU+ cells after a 2-h pulse) did not show significant differences at P60, whereas at P7 their number increased significantly in Btg1-null mice. Similarly, the total number of cycling cells (total Ki67+) increased at P7, but decreased significantly at P60; such a decrease occurred in dividing type-1 (Ki67+/GFAP+/nestin+), type-2ab (Ki67+/GFAP/nestin+) and type-2b (Ki67+/nestin+/DCX+) progenitor cells, while type-3 (Ki67+/nestin/DCX+) did not differ. Cell numbers in the dentate gyrus are mean ± SEM of the analysis of three animals per group. (C) Percentage of cells exiting the cell cycle (ratio between BrdU+/Ki67 and total BrdU+ progenitor cells; n = 3 mice) after a BrdU pulse of 2 hours or of 20 h. *p < 0.05, **p < 0.01, or ***p < 0.001 vs. Btg1+/+ dentate gyrus; Student’s t test.
Figure 5
Figure 5
Ablation of Btg1 induces a massive apoptosis in adult stem and progenitor cells of the dentate gyrus. (A) Representative confocal images of apoptotic cells in the dentate gyrus of P60 Btg1+/+ and Btg1−/− mice, showing either type-1 stem cells/type-2a progenitor cells (Caspase-3+/nestin+/DCX; red, green and blue, respectively; white arrowheads) or type-2b progenitor cells (Caspase-3+/nestin+/DCX+; white arrows). Scale bar, 25 μm. (B) Analysis in the P60 dentate gyrus of the total number of apoptotic cells (Caspase+), and of type-1–2a (Caspase-3+/nestin+/DCX), type-2b (Caspase-3+/nestin+/DCX+) and type-3 (Caspase-3+/nestin/DCX+) stem and progenitor cell. Apoptosis was significantly higher in type-1–2a stem and progenitor cells. Cell numbers are mean ± SEM of the analysis of three animals per group. **p < 0.01, or ***p < 0.001 vs. Btg1+/+ dentate gyrus; Student’s t-test.
Figure 6
Figure 6
Btg1-null adult stem and progenitor cells of the dentate gyrus undergo quiescence within 20 h and apoptosis within 5 days after entering the S phase. (A) Representative confocal images showing apoptotic type-1–2ab progenitor cells triple-labeled BrdU+/Caspase-3+/nestin+ (indicated by white arrowheads) in the P60 Btg1-null dentate gyrus after a 5-day BrdU pulse. In Btg1 wild-type dentate gyrus only BrdU/Caspase-3+/nestin+ progenitor cells are detectable (indicated by a white arrow). Scale bars, 50 μm. (B) Corresponding scheme of BrdU treatment and quantification of cell numbers, showing an increase in the Btg1-null dentate gyrus of cells undergoing apoptosis within 5 days after entering S phase, either in the total progenitor cells population (BrdU+/caspase-3+) or in type-1–2ab cells (BrdU+/caspase-3+/nestin+). (C) Representative confocal images showing Btg1-null dentate gyrus cells that soon after entering the S phase (as monitored by a 20-h BrdU pulse) become quiescent, i.e., cells that have exited the cell cycle (Ki67) and are p53-positive (BrdU+/Ki67/p53+; red, blue, and green, respectively, indicated by white arrowheads). No BrdU+/Ki67/p53+ cells are detectable in the Btg1 wild-type dentate gyrus. Dotted lines show the boundaries of the dentate gyrus. Scale bars, 50 μm. (D) Increase in Btg1-null mice of progenitor cells becoming quiescent within 20 or 48 h after entrance into S phase, either p53-positive (BrdU+/Ki67/p53+) or p21-positive (BrdU+/Ki67/p21+), respectively. P60 mice were analyzed 20 or 48 h after a single BrdU injection, as indicated. (E) The expression of p21 increases in type-1 progenitor cells (p21+/GFAP+/nestin+) of Btg1-null mice; no change occurs in type-2ab progenitor cells (p21+/GFAP/nestin+). (C–E) Cell numbers are mean ± SEM of the analysis of three animals per group. **p < 0.01 vs. Btg1+/+ dentate gyrus; Student’s t-test.
Figure 7
Figure 7
Higher apoptosis frequency and decreased number of cycling stem/progenitor cells of the adult SVZ and of 28-day-old neurons of the adult olfactory bulb. (A) Representative confocal images of coronal sections showing dividing B stem cells in the SVZ of P60 Btg1+/+ and Btg1−/− mice, identified as double-labeled Ki67+/GFAP+ cells (green and red, respectively) and indicated by white arrowheads in the white box area at higher magnification. Scale bars, 100 and 50 μm (enlargement). (A’) Analysis in P60 mice (or in P7 mice where indicated) of the number per SVZ area of dividing B stem cells (Ki67+/GFAP+), of A neuroblast cells (Ki67+/DCX+) and total dividing cells (Ki67+), as well as of total B (GFAP+) and A (DCX+) cells. At P60 B and A cells decrease strongly, relative to wild-type. (B) Representative confocal images from P60 mice of apoptotic B stem cells (Caspase-3+/GFAP+; red and green, respectively; indicated by white arrowheads). Scale bars, 50 μm. (B’) Quantification of the number per area in P60 mice of apoptotic total cells and B stem cells, which decrease strongly in Btg1-null mice, and of A neuroblast cells. On the right: greater accumulation in the SVZ of Btg1-null mice of apoptotic 1- to 5-day-old B cells that have progressed into S phase (BrdU+/Caspase-3+/GFAP+). (C) Representative images (coronal sections) of 28-day-old terminally differentiated neurons in the adult olfactory bulb, after migration from the SVZ, identified as BrdU+/NeuN+ cells (red and green, respectively). BrdU+/NeuN+ neurons are detectable in the granule cells layer (GCL) and, in lower number, in the glomerular layer (GL); the higher magnification of the ventral GCL (white box) shows a lower number in Btg1-null mice of newly generated 28-day-old neurons, as indicated also [(C’), graph on the left] by their quantification per area throughout the whole GCL (shown above is the scheme of treatment with five daily injection of BrdU performed from P55, 28 days before the analysis of the olfactory bulb). BrdU+/NeuN+ neurons in the GL did not significantly differ in number, relative to wild-type. [(C’), graph on the right] On the contrary, 28-day-old SVZ neurons, analyzed in the GCL of olfactory bulb at an earlier postnatal age (see scheme above), are present in greater number in Btg1-null mice. Scale bars, 300 and 50 μm (enlargement). (A’–C’) Cell numbers are mean ± SEM of the analysis of three animals per group. *p < 0.05, **p < 0.01, or ***p < 0.001 vs. Btg1+/+; Student’s t-test.
Figure 8
Figure 8
Btg1 loss results in an initial expansion of neural stem cells in vitro, followed by an age-dependent decrease of proliferative capacity, self-renewal, and survival. (A) Number (mean ± SEM) of clonal neurospheres derived from the subependyma of the lateral ventricle from Btg1-null and wild-type P7 or P60 mice (n = 4 and 5, respectively). Relative to control mice, neurospheres generated from P7 Btg1-null mice increased strikingly in number, while those generated from adult P60 mice decreased. (B) Volumes (mean ± SEM) of secondary neurospheres derived from Btg1-null and wild-type mice aged P7 or P60 (n = 4 and 5, respectively). With respect to wild-type mice, the volume of neurospheres from P60 Btg1-null mice was lower, after an initial increase observed in neurospheres from P7 mice. (C) Representative images of secondary neurospheres derived from Btg1-null and wild-type mice aged P7 or P60. Scale bars, 115 μm. (D) Percentage of cell expansion of primary neurosphere cultures from Btg1-null and wild-type mice (total number of cells at the end of culture divided by the initial number of cells; represented as mean percentage ± SEM, wild-type set to 100%). Relative to control, a greater expansion occurred in cells from P7 Btg1-null mice, whereas the expansion of cells derived from P60 Btg1-null mice was considerably lower (n = 4 and 5, respectively). (E) Growth curve displaying the amplification of 8000 cells derived from secondary neurospheres plated at t0, from P60 mice either Btg1-null or wild-type (n = 3). The amplification of Btg1-null cells is reduced in the long term, relative to wild-type cells. (F) Representative images of three different types of daughter-cells originating from individual NSPs from SVZ: two glial astrocytic-like proliferating progenitor cells (P–P; both labeled by GFAP), one glial astrocytic-like proliferating progenitor cell and one postmitotic neuron (P–N; labeled by GFAP and the neuronal marker TuJ1, respectively), and two postmitotic neurons (N–N; TuJ1+/TuJ1+). Scale bar 10 μm. (G,H) Quantification of the percentage of P–P, P–N, and N–N daughter-cells pair from SVZ of P7 and P60 Btg1-null and control mice. Cells counted: n = 198 and 330 for P7 Btg1+/+ and Btg1−/− mice, respectively; n = 248 and 192 for P60 Btg1+/+ and Btg1−/− mice (at least three mice per age). (I) Percentage of apoptotic cells in secondary neurospheres (mean percent ± SEM), detected as positive to activated Caspase-3. Cells from P60 Btg1-null presented a frequency 1.6-fold higher than control. *p < 0.05, **p < 0.01, or ***p < 0.001 vs. Btg1+/+; Student’s t-test.
Figure 9
Figure 9
Learning abilities of Btg1-null mice. Water maze. (A) Escape latencies of the first five trials for each of the four successive platform locations. (B) The reduction of escape latencies (saving) animals achieved as they passed from the first to the second trial of the third and fourth training sessions (averaged). (C) The number of trials animals needed to reach the performance criterion in the third and fourth training sessions (averaged). Contextual fear conditioning. (D) Experimental procedure to test one-trial contextual fear conditioning. (E) Upon re-exposure to the shock-associated context, both Btg1-null and wild-type mice showed equally increased levels of freezing behavior; conversely, negligible freezing was detected in a different context. (F) Experimental procedure to test contextual fear-discrimination learning. (G) Wild-type mice were able to discriminate between the shock-associated context and the similar context by day 4 of testing, which was stably maintained until day 7; (H) Conversely, Btg1-null mice started discriminating by day 6, with difference in freezing behavior reaching statistical significance only by day 7. Results are presented as mean ± SEM. *p < 0.05; **p < 0.01.

Similar articles

Cited by

References

    1. Aimone J. B., Deng W., Gage F. H. (2011). Resolving new memories: a critical look at the dentate gyrus, adult neurogenesis, and pattern separation. Neuron 70, 589–59610.1016/j.neuron.2011.05.010 - DOI - PMC - PubMed
    1. Alvarez-Buylla A., Lim D. A. (2004). For the long run: maintaining germinal niches in the adult brain. Neuron 41, 683–68610.1016/S0896-6273(04)00111-4 - DOI - PubMed
    1. Arguello A. A., Harburg G. C., Schonborn J. R., Mandyam C. D., Yamaguchi M., Eisch A. J. (2008). Time course of morphine’s effects on adult hippocampal subgranular zone reveals preferential inhibition of cells in S phase of the cell cycle and a subpopulation of immature neurons. Neuroscience 157, 70–7910.1016/j.neuroscience.2008.08.064 - DOI - PMC - PubMed
    1. Attardo A., Fabel K., Krebs J., Haubensak W., Huttner W. B., Kempermann G. (2010). Tis21 expression marks not only populations of neurogenic precursor cells but also new postmitotic neurons in adult hippocampal neurogenesis. Cereb. Cortex 20, 304–31410.1093/cercor/bhp100 - DOI - PMC - PubMed
    1. Berthet C., Morera A. M., Asensio M. J., Chauvin M. A., Morel A. P., Dijoud F., Magaud J. P., Durand P., Rouault J. P. (2004). CCR4-associated factor CAF1 is an essential factor for spermatogenesis. Mol. Cell. Biol. 24, 5808–582010.1128/MCB.24.13.5808-5820.2004 - DOI - PMC - PubMed