

doi: 10.3389/fnhum.2012.00250.
eCollection 2012.
Neural Oscillations in Speech: Don't be Enslaved by the Envelope
Affiliations
- PMID: 22969717
- PMCID: PMC3431501
- DOI: 10.3389/fnhum.2012.00250
Item in Clipboard
Neural Oscillations in Speech: Don't be Enslaved by the Envelope
Front Hum Neurosci.
.
No abstract available
Figures
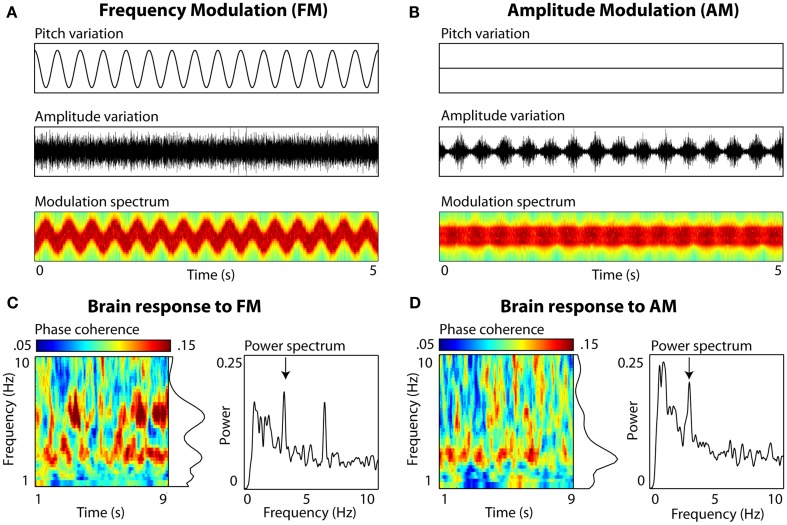
Auditory entrainment of slow neural oscillations independent of envelope fluctuations. Participants (N = 10) passively listened to 10-s complex tone stimuli (composed of 30 components sampled uniformly from a 500 Hz range), sinusoidally frequency-modulated (FM), or amplitude-modulated (AM) at a rate of 3 Hz. Electroencephalography (EEG) was recorded (data from electrode Cz shown). (A) FM stimuli. Left panels show variations in frequency (Pitch variation) and amplitude (Amplitude variation) over 5 s of stimulation. Modulation spectrum shows frequency (y axis; 200–1800 Hz, scaled linearly) and amplitude variations (color scaling) as a function of time (x axis). Note that there are no systematic variations in amplitude envelope to which brain rhythms could entrain. (B) AM stimuli. The amplitude envelope fluctuation is periodic (also visible in color fluctuation in the Modulation spectrum, scaled the same as (A), and the rate falls into the range observed in natural speech. (C) EEG brain response to FM. Inter-trial phase coherence (calculated from complex output of wavelet convolution) and power (derived from FFT) quantified the degree of entrainment. For FM stimuli, peaks in both phase coherence (p = 0.03) and power (p = 0.006) were observed at 3 Hz (delta) and at the 6-Hz harmonic (p = 0.03 and p = 0.001, resp.; Picton et al., 2003). (D) EEG brain response to AM. A single peak in phase coherence and power was observed at 3 Hz (both p = 0.03).
References
LinkOut - more resources
Full Text Sources