. 2012 Sep 3:3:350.
doi: 10.3389/fphys.2012.00350. eCollection 2012.

Intracellular calcium signals display an avalanche-like behavior over multiple lengthscales

Affiliations

Intracellular calcium signals display an avalanche-like behavior over multiple lengthscales

Lucía Lopez et al. Front Physiol. .

Abstract

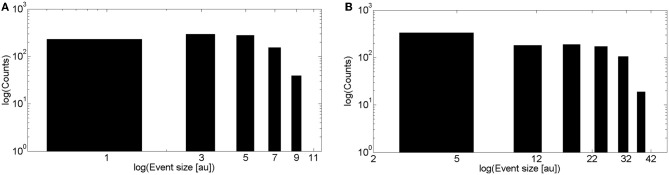
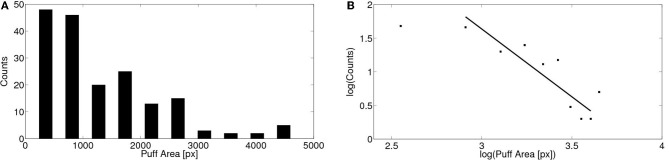
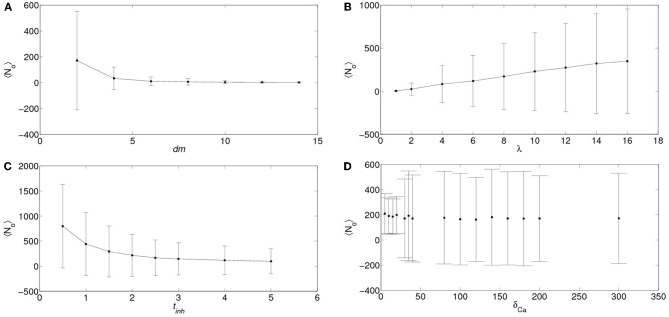
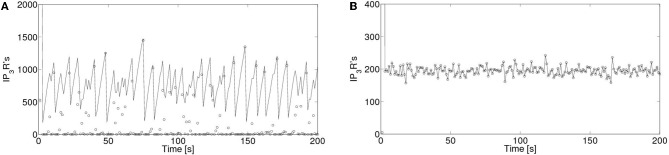
Many natural phenomena display "self-organized criticality" (SOC), (Bak et al., 1987). This refers to spatially extended systems for which patterns of activity characterized by different lengthscales can occur with a probability density that follows a power law with pattern size. Differently from power laws at phase transitions, systems displaying SOC do not need the tuning of an external parameter. Here we analyze intracellular calcium (Ca(2+)) signals, a key component of the signaling toolkit of almost any cell type. Ca(2+) signals can either be spatially restricted (local) or propagate throughout the cell (global). Different models have suggested that the transition from local to global signals is similar to that of directed percolation. Directed percolation has been associated, in turn, to the appearance of SOC. In this paper we discuss these issues within the framework of simple models of Ca(2+) signal propagation. We also analyze the size distribution of local signals ("puffs") observed in immature Xenopus Laevis oocytes. The puff amplitude distribution obtained from observed local signals is not Gaussian with a noticeable fraction of large size events. The experimental distribution of puff areas in the spatio-temporal record of the image has a long tail that is approximately log-normal. The distribution can also be fitted with a power law relationship albeit with a smaller goodness of fit. The power law behavior is encountered within a simple model that includes some coupling among individual signals for a wide range of parameter values. An analysis of the model shows that a global elevation of the Ca(2+) concentration plays a major role in determining whether the puff size distribution is long-tailed or not. This suggests that Ca(2+)-clearing from the cytosol is key to determine whether IP(3)-mediated Ca(2+) signals can display a SOC-like behavior or not.

Keywords: calcium signals; percolation; phase transition; puffs; self-organized criticality.


Figures

Figure 1
Figure 1
Linescan image with two puffs in the same site. (A) ΔF/F0 fluorescence image with the corresponding color code. (B) Δ F/F0 thresholded binary image.
Figure 2
Figure 2
Puff amplitude as funcion of puff occurrence. Mean amplitude (symbols) and corresponding standard deviation (vertical lines) of puffs that occurred within the same 1 s interval along the experimental record as a function of the time elapsed since the delivery of the UV pulse.
Figure 3
Figure 3
Event size distributions obtained with simulations of the intra and intercluster models without Ca2+ accumulation. (A) Distribution obtained with 1000 realizations of the intracluster (local) model using the parameters described in the “Materials and Methods” section (B) Similar to (A), but for the intercluster model without Ca2+ accumulation. See main text for the simulation parameter values.
Figure 4
Figure 4
Transition between Ca2+-binding limited and IP3-binding limited cases in the event size distribution of the inter-cluster model. (A) Similar to Figure 3B but using a mean number of IP3-bound IP3R's equal to 4. (B) Similar to (A) but using a mean number of IP3-bound IP3R's equal to 20.
Figure 5
Figure 5
Distribution of puff amplitudes obtained experimentally. (A) Distribution obtained by pooling together data from 202 puffs observed in 13 cells. Experiments were performed as explained in the “Materials and Methods” sections. (B) Same as (A) but on a logarithmic scale.
Figure 6
Figure 6
Distribution of puff areas obtained experimentally. (A) Similar to Figure 5 but for the area covered by the puffs. Areas were determined as explained in the “Materials and Methods” section pooling data from 179 puffs observed in 12 cells. (B) Same as (A) but on a logarithmic scale. By fitting a power law relationship to some of the data points we obtain exponents between 1.8 and 2.0 with ℛ2 between 0.77 and 0.81 (if we include data between 800 and 4500 px or between 800 and 4000 px, respectively).
Figure 7
Figure 7
Distributions of clusters and of receptors involved obtained with simulations of intercluster dynamics with calcium accumulation. (A) Distribution of the number of clusters involved in each signal displayed on a logarithmic scale. By fitting a power law relationship to some of the data points we obtain exponents between 1 and 1.4 with ℛ2 between 0.72 and 0.85 (if we include data between 30 and 80 clusters involved, respectively). (B) Distribution of the number of IP3R's involved on a logarithmic scale. By fitting a power law relationship to some of the data points we obtain exponents between 1 and 1.7 with ℛ2 between 0.76 and 0.92 (if we include data between 20 and 80 IP3R's involved, respectively).
Figure 8
Figure 8
Dependence of the number of IP3R's that participate of a signal on various parameters. Mean (symbols) and standard deviations (vertical lines around mean) of the number of IP3R's that participate of a signal, No, as a function of the inter-cluster distance, dm (A), of the mean number of IP3-bound IP3R's per cluster, λ (B), of the mean IP3R inhibition time, tinh (C), and of the cytosolic Ca2+ clearing rate, δCa (D). In all the subfigures, the parameters that are not varied are fixed at the values used in section 5.
Figure 9
Figure 9
Event size distributions obtained for different values of the cytosolic Ca2+ clearing rate. Distribution of the number of IP3R's that participate of the signals when all the parameters are kept at the values used in section 5 except for the cytosolic Ca2+ clearing rate for which we used: (A) δCa = 20/s, (B) δCa = 25/s, (C) δCa = 30/s, (D) δCa = 200/s.
Figure 10
Figure 10
Number of active IP3R's and of IP3R's that are participating of a signal as a function of time. Number of active IP3R's, Nact (with solid lines) and of open IP3R's, No (with open circles) as a function of time for (A) δCa = 200/s and for (B) δCa = 20/s.

Similar articles

Cited by

References

    1. Allbritton N., Meyer T., Stryer L. (1992). Range of messenger action of calcium ion and inositol 1,4,5-trisphosphate. Science 258, 1812–1815 10.1126/science.1465619 - DOI - PubMed
    1. Bak P. (1996). How Nature Works. New York, NY: Copernicus
    1. Bak P., Sneppen K. (1993). Punctuated equilibrium and criticality in a simple model of evolution. Phys. Rev. Lett. 71, 4083–4086 - PubMed
    1. Bak P., Tang C., Wiesenfeld K. (1987). Self-organized criticality: an explanation of the 1/f noise. Phys. Rev. Lett. 59, 381–384 - PubMed
    1. Bak P., Tang C., Wiesenfeld K. (1988). Self-organized criticality. Phys. Rev. A 38, 364–374 10.1103/PhysRevA.38.364 - DOI - PubMed