. 2012 Aug 31:3:318.
doi: 10.3389/fmicb.2012.00318. eCollection 2012.

Spatial and temporal scales of aquatic bacterial beta diversity

Affiliations

Spatial and temporal scales of aquatic bacterial beta diversity

Stuart E Jones et al. Front Microbiol. .

Abstract

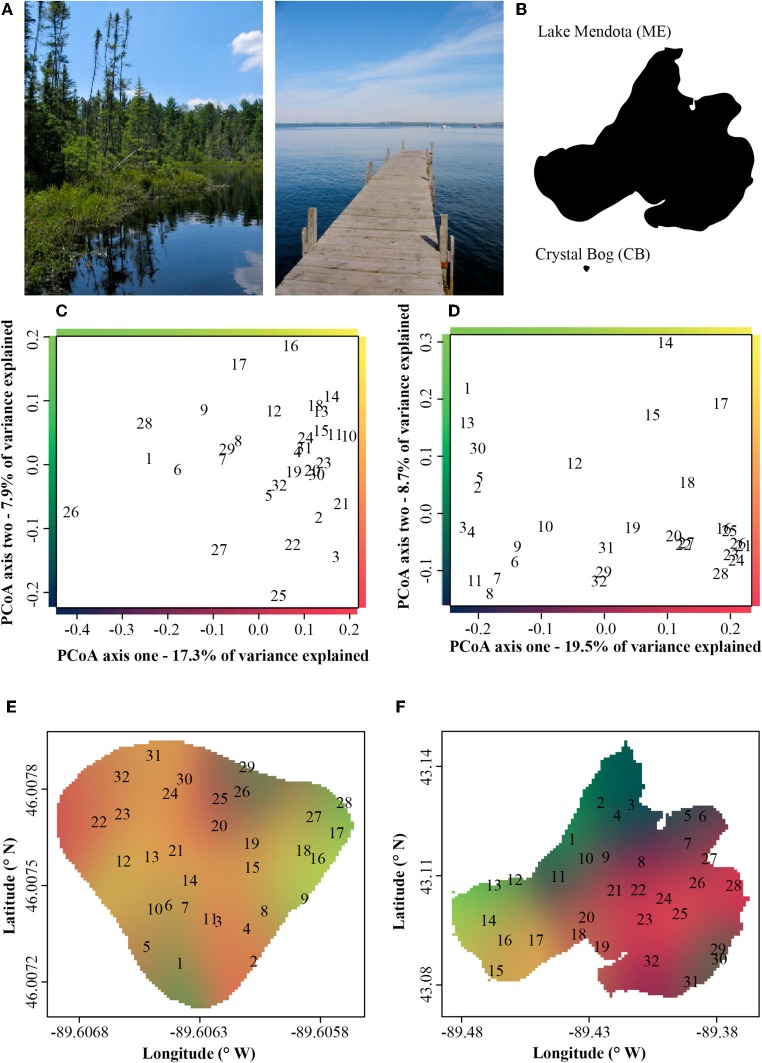
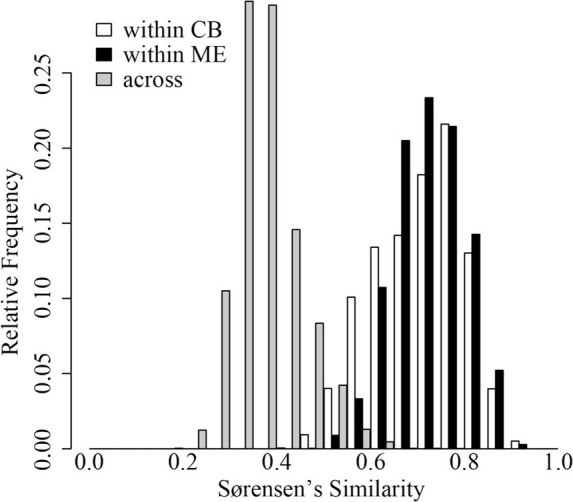
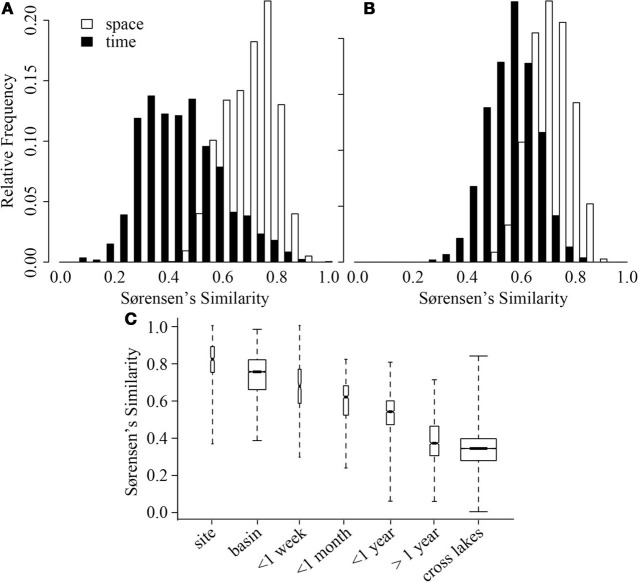
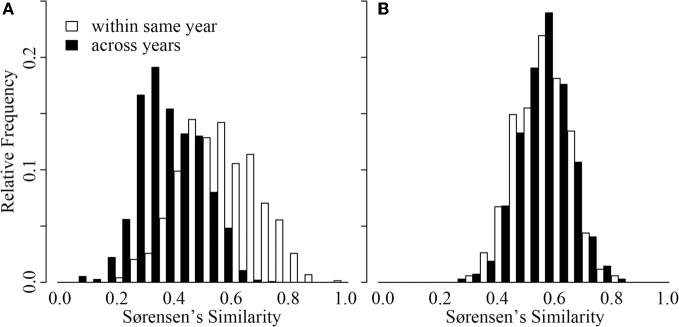
Understanding characteristic variation in aquatic bacterial community composition (BCC) across space and time can inform us about processes driving community assembly and the ability of bacterial communities to respond to perturbations. In this study, we synthesize BCC data from north temperate lakes to evaluate our current understanding of how BCC varies across multiple scales in time and space. A hierarchy of average similarity emerged with the highest similarity found among samples collected within the same lake, especially within the same basin, followed by similarity among samples collected through time within the same lake, and finally similarity among samples collected from different lakes. Using decay of similarity across time and space, we identified equivalent temporal (1 day) and spatial (10 m) scales of BCC variation. Finally, we identify an intriguing pattern of contrasting patterns of intra- and inter-annual BCC variation in two lakes. We argue our synthesis of spatio-temporal variation of aquatic BCC informs expectations for the response of aquatic bacterial communities to perturbation and environmental change. However, further long-term temporal observations will be needed to develop a general understanding of inter-annual BCC variation and our ability to use aquatic BCC as a sensitive metric of environmental change.

Keywords: beta diversity; lake; spatial; temporal.


Figures

Figure 1
Figure 1
(A) Pictorial and (B) areal contrast in the Lake Mendota (ME) and Crystal Bog (CB) environments. Principle coordinate analysis (PCoA) ordinations of bacterial community composition at 32 sites in Crystal Bog (C) and Lake Mendota (D), collected on a single day. Points indicated as sample site numbers represent the mean of triplicate ordinated samples. The axes of the ordinations are color-coded and these colors are used to indicate bacterial community composition on the lake maps in panels E (Crystal Bog) and F (Lake Mendota).
Figure 2
Figure 2
Distribution of Sørensen's similarity indices within 32 sites in Crystal Bog (within CB; open bars), within 32 sites in Lake Mendota (within ME; black bars), and between sites in Crystal Bog and Lake Mendota (across lakes; gray bars). Similarities were calculated as pair-wise comparisons of all samples within a set (e.g., 512 pairwise combinations for the 32 sites in CB).
Figure 3
Figure 3
Distribution of Sørensen's similarity indices for samples from Crystal Bog (A) and Lake Mendota (B) distributed spatially within the lake (open bars) and through time (black bars). Comparisons across space were conducted using the 32 samples collected on a single day from each lake. Comparisons across time were conducted using 68 samples from CB collected in 2003, 2005, and 2007 (previously unpublished), and 46 samples from ME collected in 2000, 2001, and 2005 (Shade et al., 2007). (C) Distribution of pairwise Sørensen's similarities calculated for multiple scales of time and space. Bold lines delineate medians, box heights represent the interquartile range, and whiskers mark the extremes of the data. Width of a box is proportional to the number of similarities in the category. Data from: Yannarell and Triplett (2004, 2005); Shade et al. (2007), and the current study, see Table 2.
Figure 4
Figure 4
Distribution of Sørensen's similarity indices for samples collected within the same year (open bars) and samples collected across years (black bars) from Crystal Bog (A) and Lake Mendota (B). Comparisons were conducted using 68 samples from CB collected in 2003, 2005, and 2007 (previously unpublished), and 46 samples from ME collected in 2000, 2001, and 2005 (Shade et al., 2007).

Similar articles

Cited by

References

    1. Adler P. B., Lauenroth W. K. (2003). The power of time: spatiotemporal scaling of species diversity. Ecol. Lett. 6, 749–756
    1. Allgaier M., Grossart H. P. (2006). Diversity and seasonal dynamics of Actinobacteria populations in four lakes in northeastern Germany. Appl. Environ. Microbiol. 72, 3489–3497 10.1128/AEM.72.5.3489-3497.2006 - DOI - PMC - PubMed
    1. Anderson M. J., Crist T. O., Chase J. M., Vellend M., Inouye B. D., Freestone A. L., Sanders N. J., Cornell H. V., Comita L. S., Davies K. F., Harrison S. P., Kraft N. J. B., Stegen J. C., Swenson N. G. (2011). Navigating the multiple meanings of beta diversity: a roadmap for the practicing ecologist. Ecol. Lett. 14, 19–28 10.1111/j.1461-0248.2010.01552.x - DOI - PubMed
    1. Baddeley A., Turner R. (2005). Spatstat: an R package for analyzing spatial point patterns. J. Stat. Softw. 12, 1–42
    1. Berdjeb L., Ghiglione J. F., Domaizon I., Jacquet S. (2011). A two-year assessment of the main environmental factors driving the free-living bacterial community structure in Lake Bouret (France). Microb. Ecol. 61, 941–954 10.1007/s00248-010-9767-6 - DOI - PubMed

LinkOut - more resources