. 2012 Aug 27:3:157.
doi: 10.3389/fgene.2012.00157. eCollection 2012.

Detection of expression quantitative trait Loci in complex mouse crosses: impact and alleviation of data quality and complex population substructure

Affiliations

Detection of expression quantitative trait Loci in complex mouse crosses: impact and alleviation of data quality and complex population substructure

Ovidiu D Iancu et al. Front Genet. .

Abstract

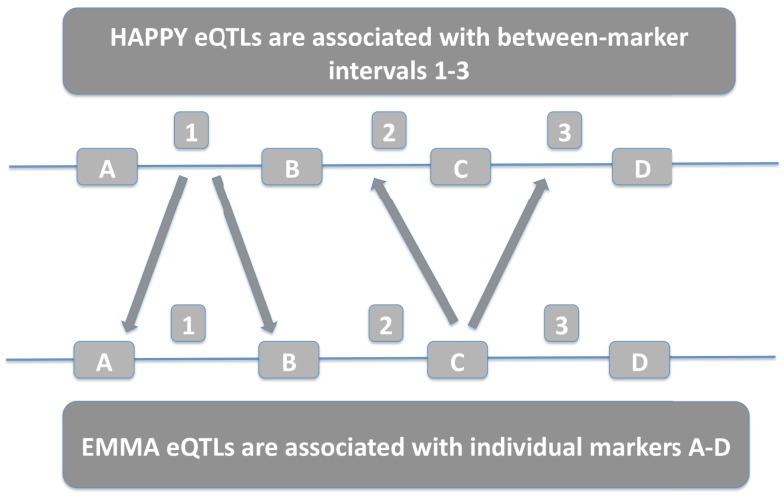
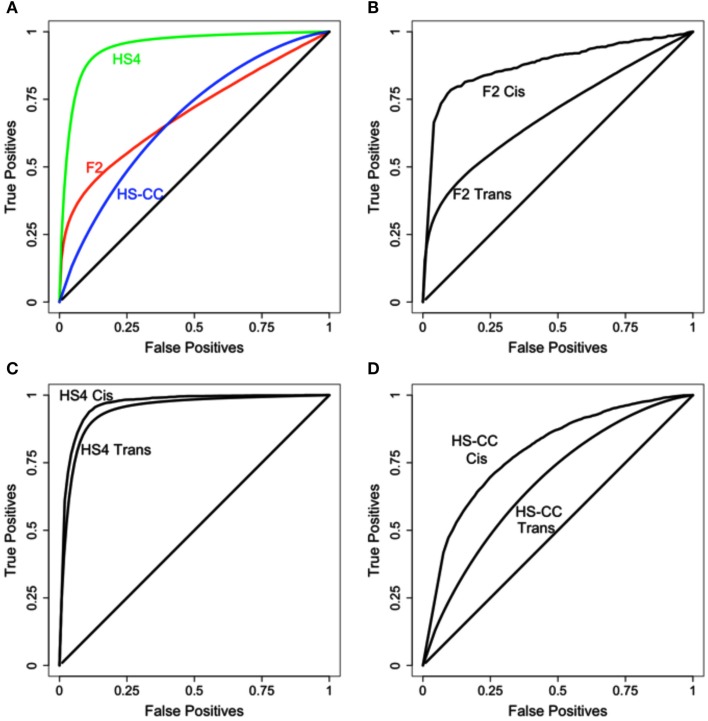
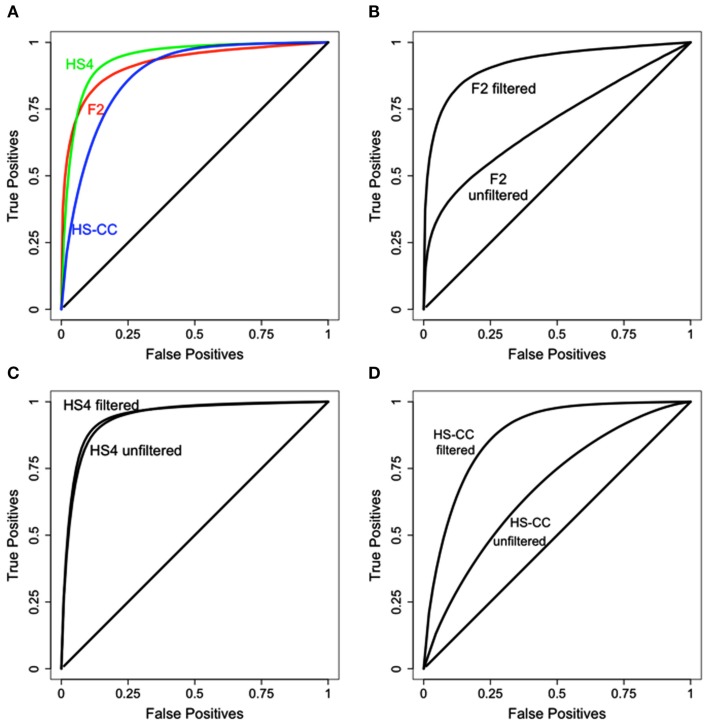
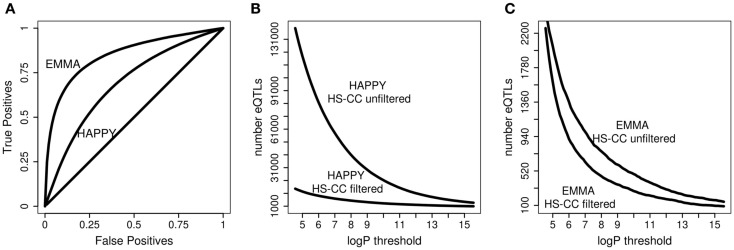
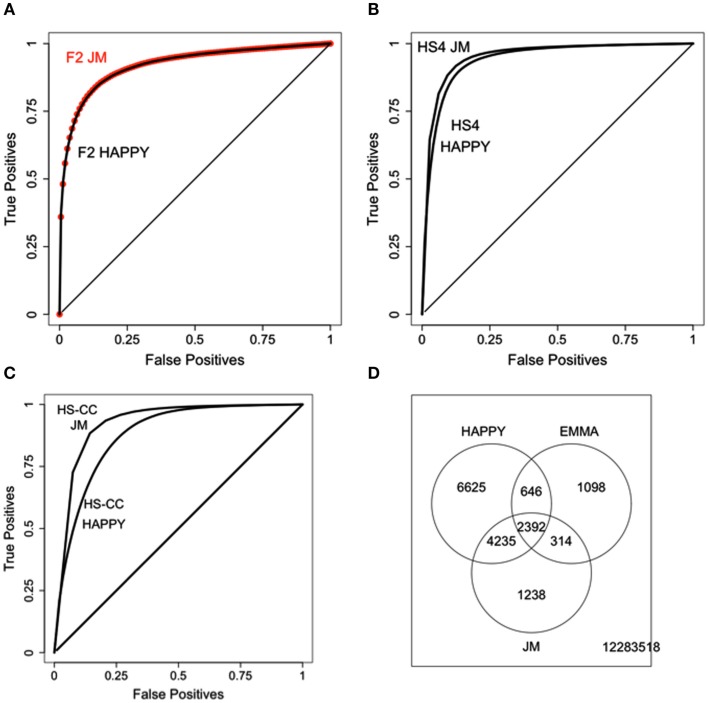
Complex Mus musculus crosses, e.g., heterogeneous stock (HS), provide increased resolution for quantitative trait loci detection. However, increased genetic complexity challenges detection methods, with discordant results due to low data quality or complex genetic architecture. We quantified the impact of theses factors across three mouse crosses and two different detection methods, identifying procedures that greatly improve detection quality. Importantly, HS populations have complex genetic architectures not fully captured by the whole genome kinship matrix, calling for incorporating chromosome specific relatedness information. We analyze three increasingly complex crosses, using gene expression levels as quantitative traits. The three crosses were an F(2) intercross, a HS formed by crossing four inbred strains (HS4), and a HS (HS-CC) derived from the eight lines found in the collaborative cross. Brain (striatum) gene expression and genotype data were obtained using the Illumina platform. We found large disparities between methods, with concordance varying as genetic complexity increased; this problem was more acute for probes with distant regulatory elements (trans). A suite of data filtering steps resulted in substantial increases in reproducibility. Genetic relatedness between samples generated overabundance of detected eQTLs; an adjustment procedure that includes the kinship matrix attenuates this problem. However, we find that relatedness between individuals is not evenly distributed across the genome; information from distinct chromosomes results in relatedness structure different from the whole genome kinship matrix. Shared polymorphisms from distinct chromosomes collectively affect expression levels, confounding eQTL detection. We suggest that considering chromosome specific relatedness can result in improved eQTL detection.

Keywords: collaborative cross; eQTL detection; gene expression; mouse genetics; population substructure.


Figures

Figure 1
Figure 1
HAPPY intervals are compared with EMMA individual markers. HAPPY eQTLs associated with interval 1 correspond to EMMA eQTLs associated with either marker A or marker B. EMMA eQTLs associated with marker C correspond with HAPPY eQTLs associated with either interval 2 or 3.
Figure 2
Figure 2
Initial comparison of eQTL detection across mouse crosses and methods. (A) Level of overlap across the three mouse crosses; HS4 results are superior to both F2 and HS-CC. (B–D) Cis results are more reproducible in all three datasets.
Figure 3
Figure 3
Results of data filtering on the concordance between HAPPY and EMMA. (A) Concordance comparison across the three data sets. HS4 concordance is best, with HS-CC and F2 slightly behind. (B–D) Concordance before and after data filtering. In all cases data filtering improves concordance between the methods.
Figure 4
Figure 4
Concordance of results and number of eQTLs for the probes retained after data filtering. (A) The HAPPY and EMMA results for the retained probes are compared using ROC analysis. (B,C) Number of eQTLs detected by HAPPY and EMMA, respectively, before and after data filtering.
Figure 5
Figure 5
Results of the JM procedure. (A) JM compared with HAPPY in the F2 data. There is no improvement in the ability to reproduce the original EMMA results. (B) HS4 results show better ability of JM to reproduce EMMA results. (C) HS-CC results, JM has best improvement of JM of HAPPY. (D) Overlap of eQTLs (p < 10–5) across the three methods with JM detecting a large portion of intersection of HAPPY and EMMA results.

Similar articles

Cited by

References

    1. Aldinger K. A., Sokoloff G., Rosenberg D. M., Palmer A. A., Millen K. J. (2009). Genetic variation and population substructure in outbred CD-1 mice: implications for genome-wide association studies. PLoS ONE 4, e4729.10.1371/journal.pone.0004729 - DOI - PMC - PubMed
    1. Archer K. J., Reese S. E. (2009). Detection call algorithms for high-throughput gene expression microarray data. Brief Bioinform. 11, 244–25210.1093/bib/bbp055 - DOI - PMC - PubMed
    1. Baty F., Jaeger D., Preiswerk F., Schumacher M. M., Brutsche M. H. (2008). Stability of gene contributions and identification of outliers in multivariate analysis of microarray data. BMC Bioinformatics 9, 289.10.1186/1471-2105-9-289 - DOI - PMC - PubMed
    1. Broman K. W., Wu H., Sen S., Churchill G. A. (2003). R/qtl: QTL mapping in experimental crosses. Bioinformatics 19, 889–89010.1093/bioinformatics/btg112 - DOI - PubMed
    1. Churchill G. A. (2002). Fundamentals of experimental design for cDNA microarrays. Nat. Genet. 32, 490–49510.1038/ng1031 - DOI - PubMed

LinkOut - more resources