. 2012;7(9):e42786.
doi: 10.1371/journal.pone.0042786. Epub 2012 Sep 6.

Assessing bacterial populations in the lung by replicate analysis of samples from the upper and lower respiratory tracts

Affiliations

Assessing bacterial populations in the lung by replicate analysis of samples from the upper and lower respiratory tracts

Emily S Charlson et al. PLoS One. 2012.

Abstract

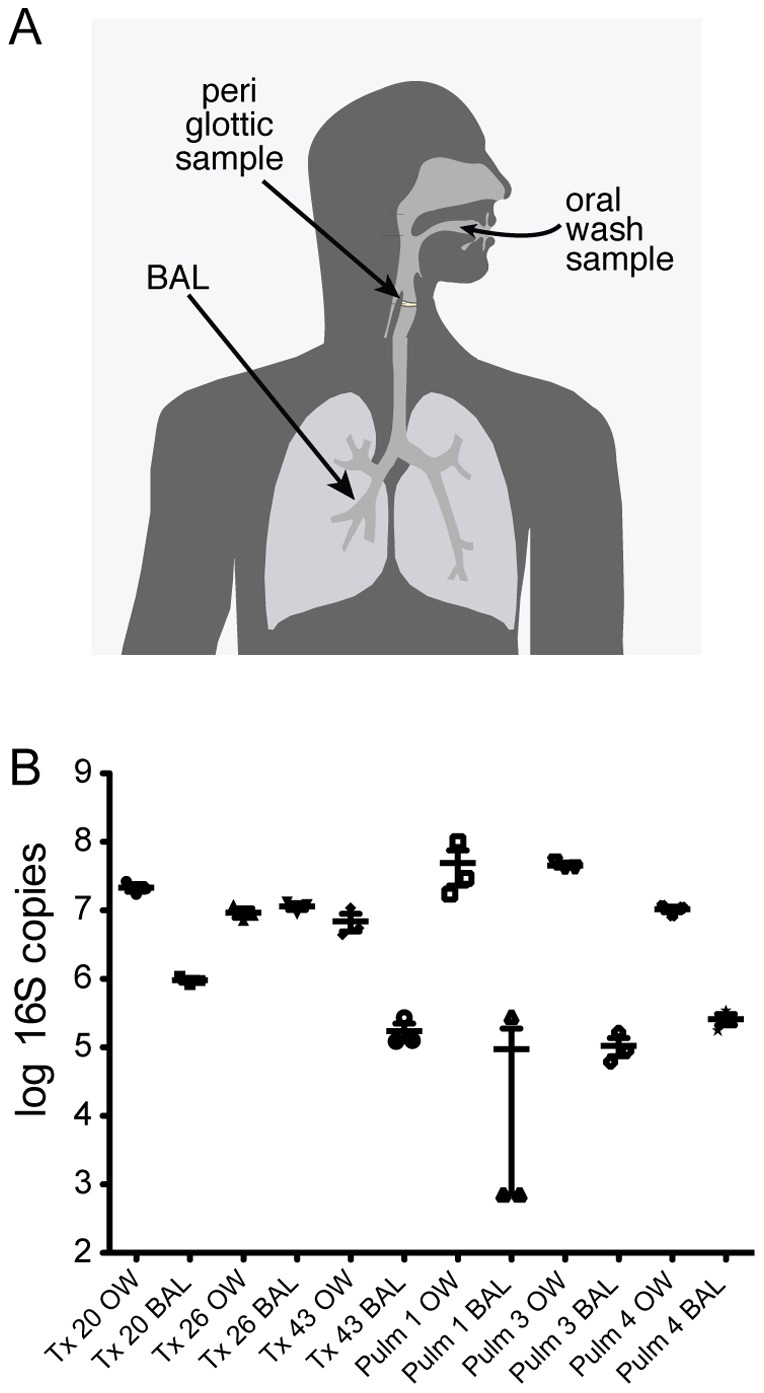
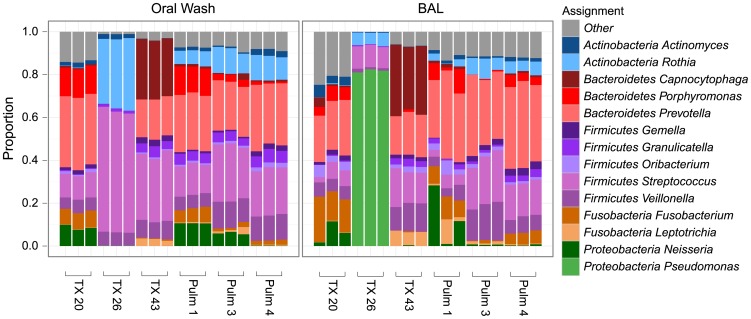
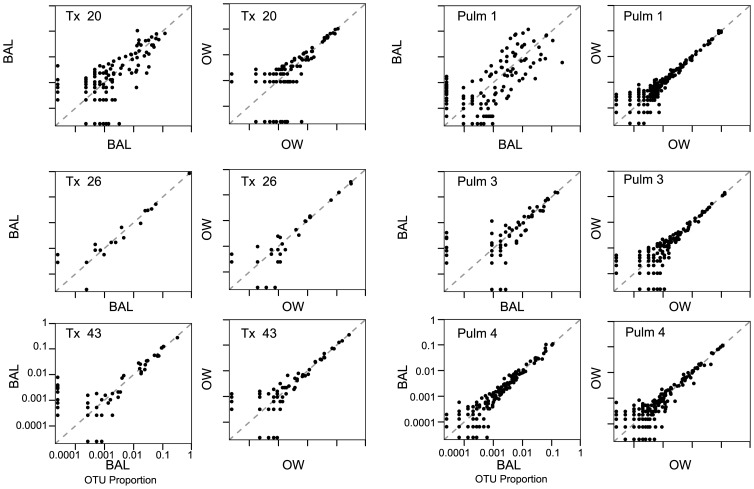
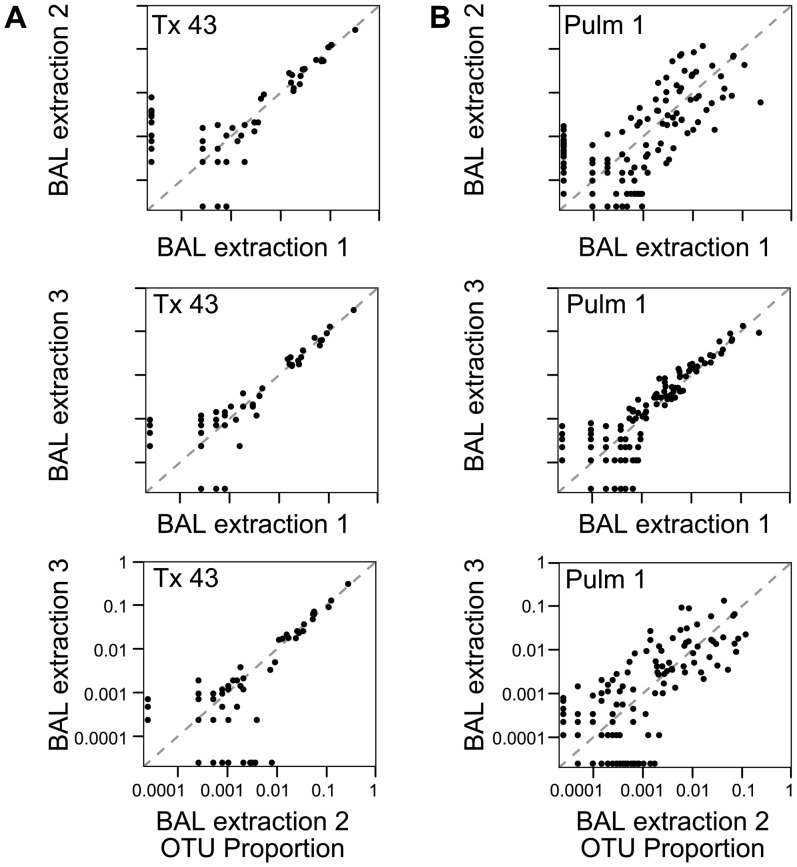
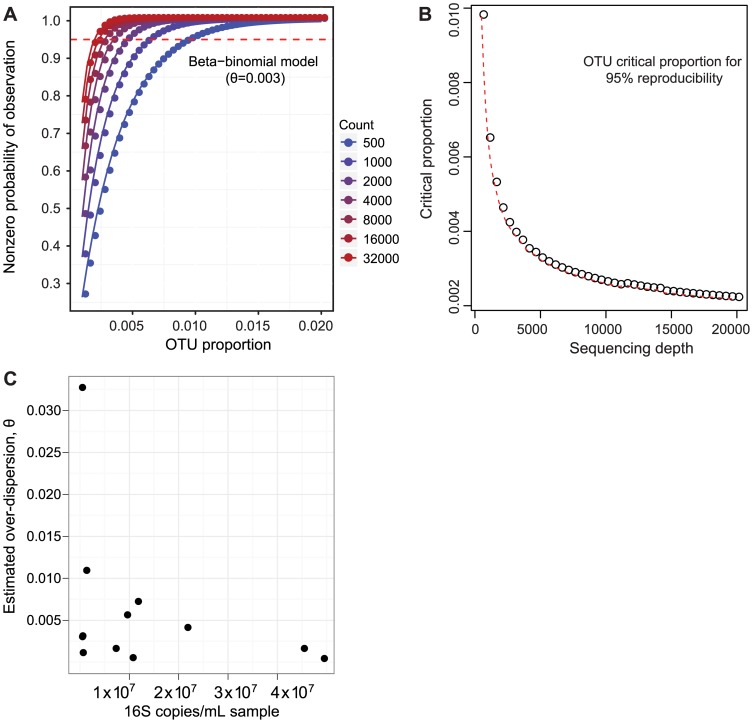
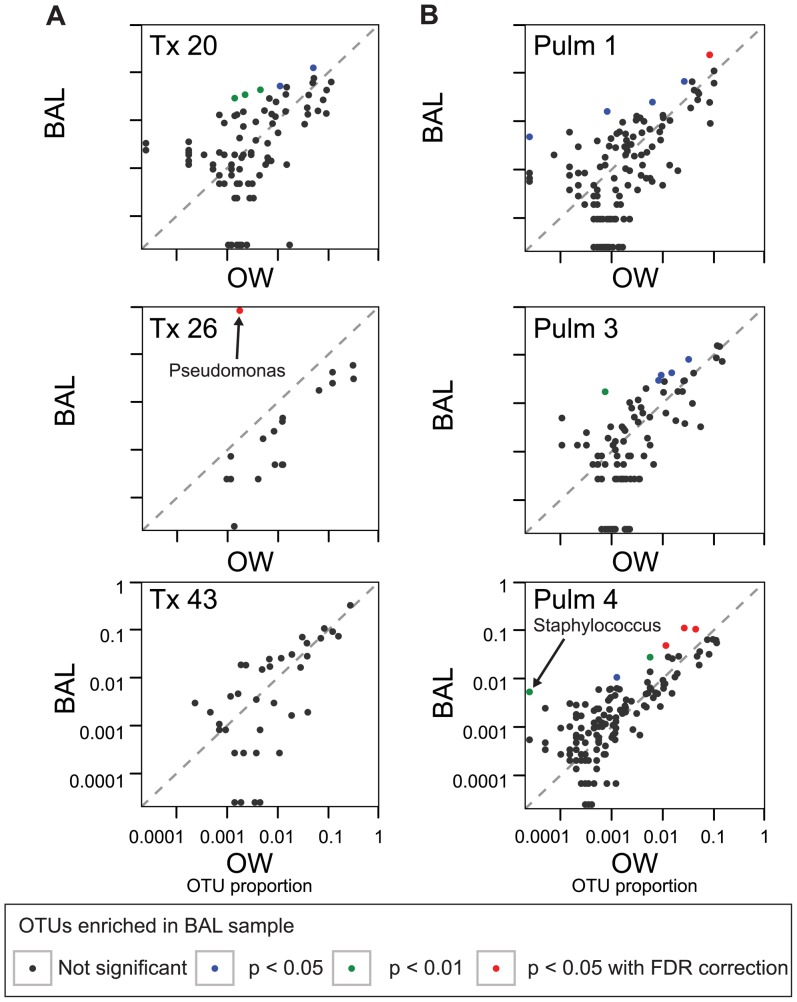
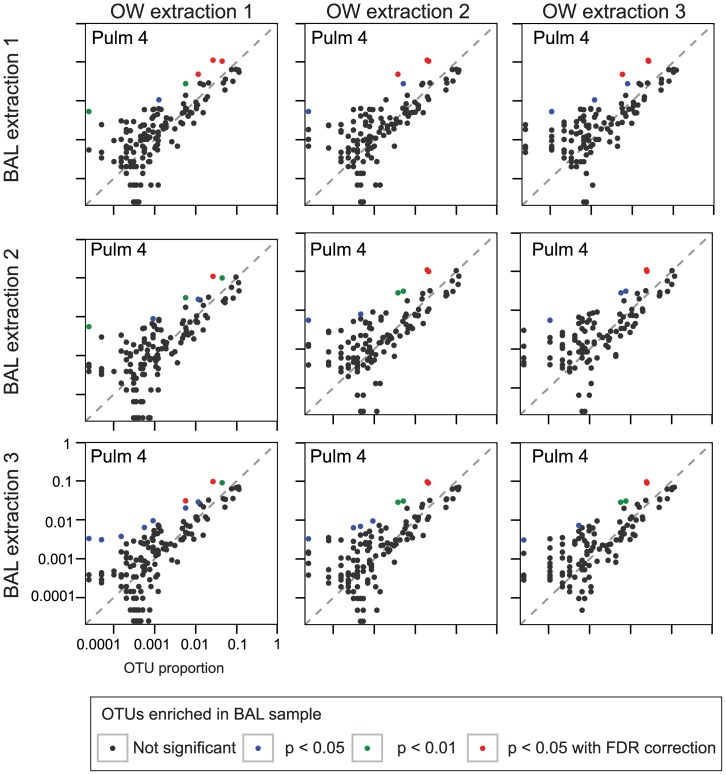
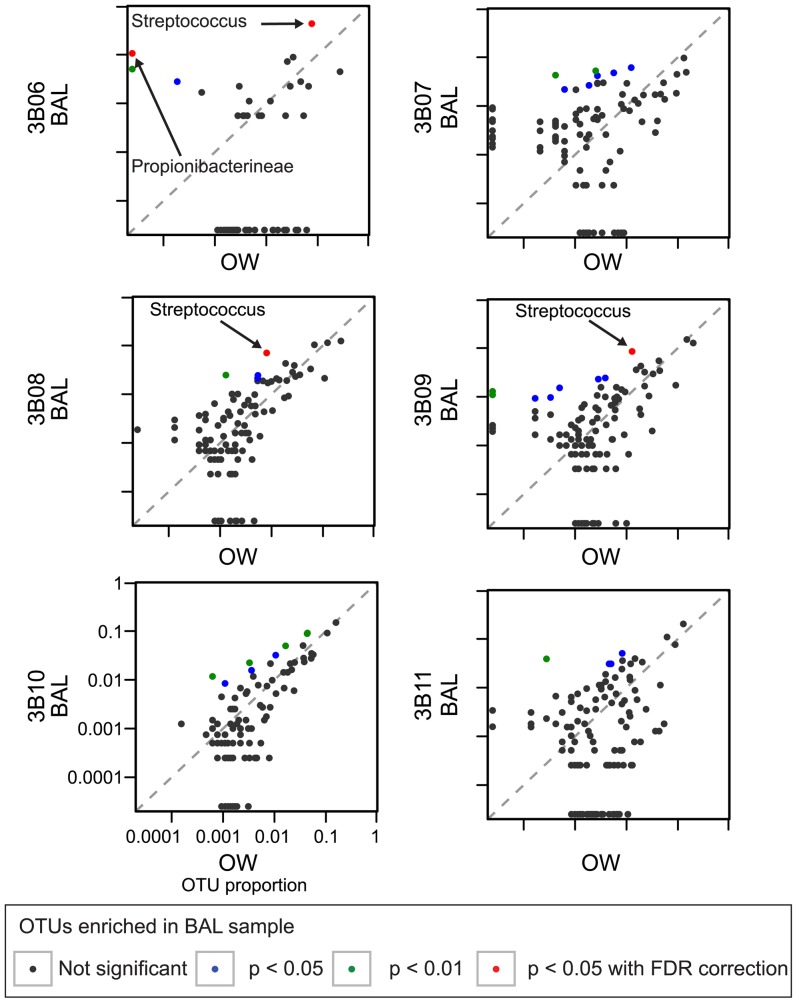
Microbes of the human respiratory tract are important in health and disease, but accurate sampling of the lung presents challenges. Lung microbes are commonly sampled by bronchoscopy, but to acquire samples the bronchoscope must pass through the upper respiratory tract, which is rich in microbes. Here we present methods to identify authentic lung microbiota in bronchoalveolar lavage (BAL) fluid that contains substantial oropharyngeal admixture. We studied clinical BAL samples from six selected subjects with potential heavy lung colonization. A single sample of BAL fluid was obtained from each subject along with contemporaneous oral wash (OW) to sample the oropharynx, and then DNA was extracted from three separate aliquots of each. Bacterial 16S rDNA sequences were amplified and products analyzed by 454 pyrosequencing. By comparing replicates, we were able to specify the depth of sequencing needed to reach a 95% chance of identifying a bacterial lineage of a given proportion--for example, at a depth of 5,000 tags, OTUs of proportion 0.3% or greater would be called with 95% confidence. We next constructed a single-sided outlier test that allowed lung-enriched organisms to be quantified against a background of oropharyngeal admixture, and assessed improvements available with replicate sequence analysis. This allowed identification of lineages enriched in lung in some BAL specimens. Finally, using samples from healthy volunteers collected at multiple sites in the upper respiratory tract, we show that OW provides a reasonable but not perfect surrogate for bacteria carried into to the lung by a bronchoscope. These methods allow identification of microbes that can replicate in the lung despite the background due to oropharyngeal microbes derived from aspiration and bronchoscopic carry-over.


Conflict of interest statement

Competing Interests: The authors have declared that no competing interests exist.

Figures

Figure 1
Figure 1. Quantification of bacterial 16S rDNA gene copies in oral wash and bronchoalveolar lavage.
A) Diagram of the airway sites sampled in this study. B) The x-axis indicates the sample studied, the y-axis the log of the number of 16S rDNA gene copies estimated by quantitative PCR. Each sample was analyzed in triplicate. Note that this comparison assumes that the average number of 16S rDNA genes per genome is not substantially different for the ensembles of species in each category.
Figure 2
Figure 2. Relative abundances of bacterial genera found in oral wash and BAL samples.
The x-axis shows the sample studied, the y-axis the proportion of each lineage as reported by comparison to the RDP database. Taxa are indicated at the Genus level.
Figure 3
Figure 3. Examples of reproducibility in OTU proportions for replicate samples.
Bivariate plots are shown comparing OTU abundance from replicate sequence analysis of aliquots from the same BAL or OW sample. The type of sample is indicated on each axis, the subject of origin inside each box. Proportions are shown on a log scale. The pairs of replicates used for display were chosen randomly from among the three for each sample.
Figure 4
Figure 4. Comparison of reproducibility for all three BAL samples from subjects Tx 43 and Pulm 1.
The subject is indicated at the top within each box, the replicates compared are indicated along each axis.
Figure 5
Figure 5. Quantification of sequencing depth necessary for 95% confidence in detection of OTUs at different abundances by different sequencing depths.
(A) Probability of observing an OTU upon repeat sequencing of 16S rDNA at a given OTU proportion and sequencing depth, as modeled by a beta-binomial distribution. The level of over-dispersion used in the plot, θ = 0.003, is the median estimate from all replicate sample comparisons. (B) Plot of 16S rDNA OTU critical proportion for 95% confidence of detection. (C) 16S rDNA copies/mL in each sample (x-axis) vs. the over-dispersion parameter θ (y-axis), indicating that a greater level of over-dispersion is associated with fewer starting copies.
Figure 6
Figure 6. Characterization of lung-specific microorganisms using single sided outlier plots to compare single OW and BAL samples.
A single OW sample (x-axis) and a single BAL sample (y-axis) were used for comparison for each subject (out of three samples of each for each subject). The color code indicates the results of significance testing for OTU outliers against a beta-binomial distribution. “FDR” indicates false discovery rate.
Figure 7
Figure 7. Characterization of all pair-wise comparisons of the three BAL and OW samples from Pulm 4.
The three OW samples are shown on the x-axis, the BAL samples on the y-axis. The significance is again shown by the color code indicated at the bottom of the figure.
Figure 8
Figure 8. Application of the single sided outlier analysis to a single OW and BAL sample from a healthy population.
An OW sample (x-axis) and the BAL 1st Return sample (y-axis) were used for comparison for each subject. The color code indicates the results of significance testing for outliers against a beta-binomial distribution. Data from .

Similar articles

Cited by

References

    1. Jordan GW, Wong GA, Hoeprich PD (1976) Bacteriology of the lower respiratory tract as determined by fiber-optic bronchoscopy and transtracheal aspiration. J Infect Dis 134: 428–435. - PubMed
    1. Kirkpatrick MB, Bass JB Jr (1989) Quantitative bacterial cultures of bronchoalveolar lavage fluids and protected brush catheter specimens from normal subjects. Am Rev Respir Dis 139: 546–548. - PubMed
    1. Pecora DV (1963) A Comparison of Transtracheal Aspiration with Other Methods of Determining the Bacterial Flora of the Lower Respiratory Tract. N Engl J Med 269: 664–666. - PubMed
    1. Bartlett JG, Alexander J, Mayhew J, Sullivan-Sigler N, Gorbach SL (1976) Should fiberoptic bronchoscopy aspirates be cultured? Am Rev Respir Dis 114: 73–78. - PubMed
    1. Charlson ES, Bittinger K, Haas AR, Fitzgerald AS, Frank I, et al. (2011) Topographical continuity of bacterial populations in the healthy human respiratory tract. Am J Respir Crit Care Med 184: 957–963. - PMC - PubMed

Publication types