. 2012;7(9):e43601.
doi: 10.1371/journal.pone.0043601. Epub 2012 Sep 10.

Mapping the mechanome of live stem cells using a novel method to measure local strain fields in situ at the fluid-cell interface

Affiliations

Mapping the mechanome of live stem cells using a novel method to measure local strain fields in situ at the fluid-cell interface

Min Jae Song et al. PLoS One. 2012.

Abstract

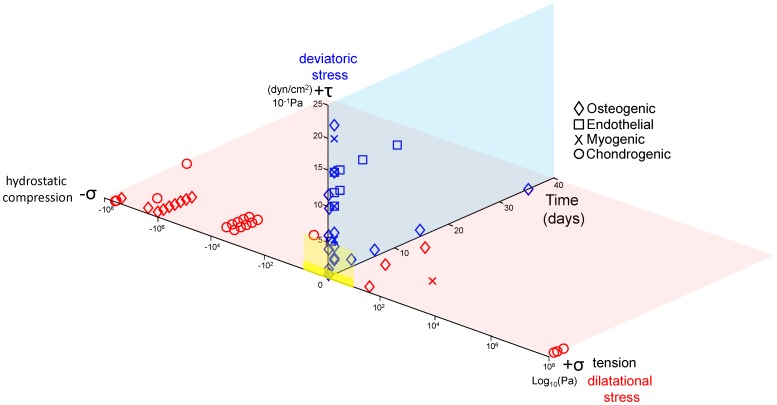
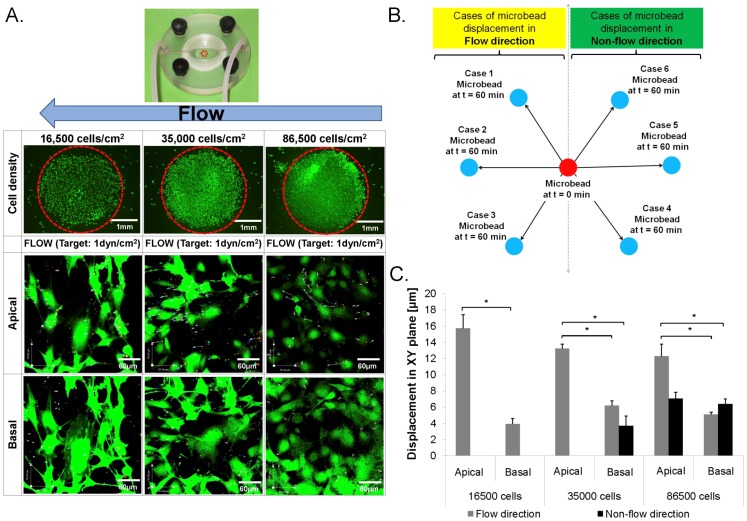
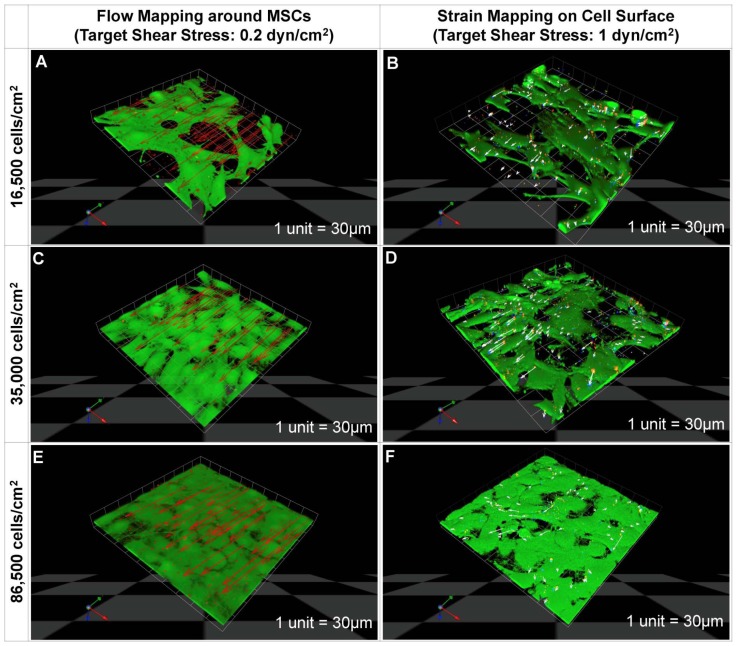
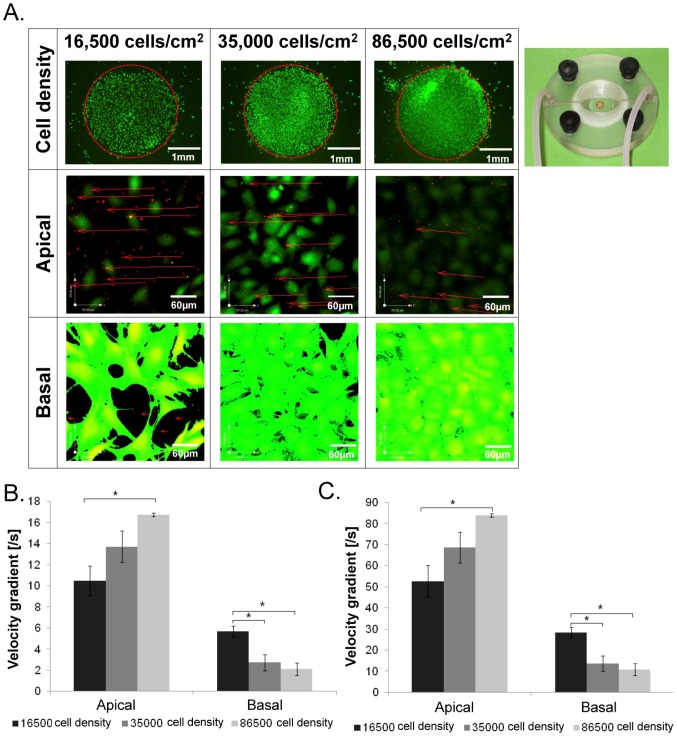
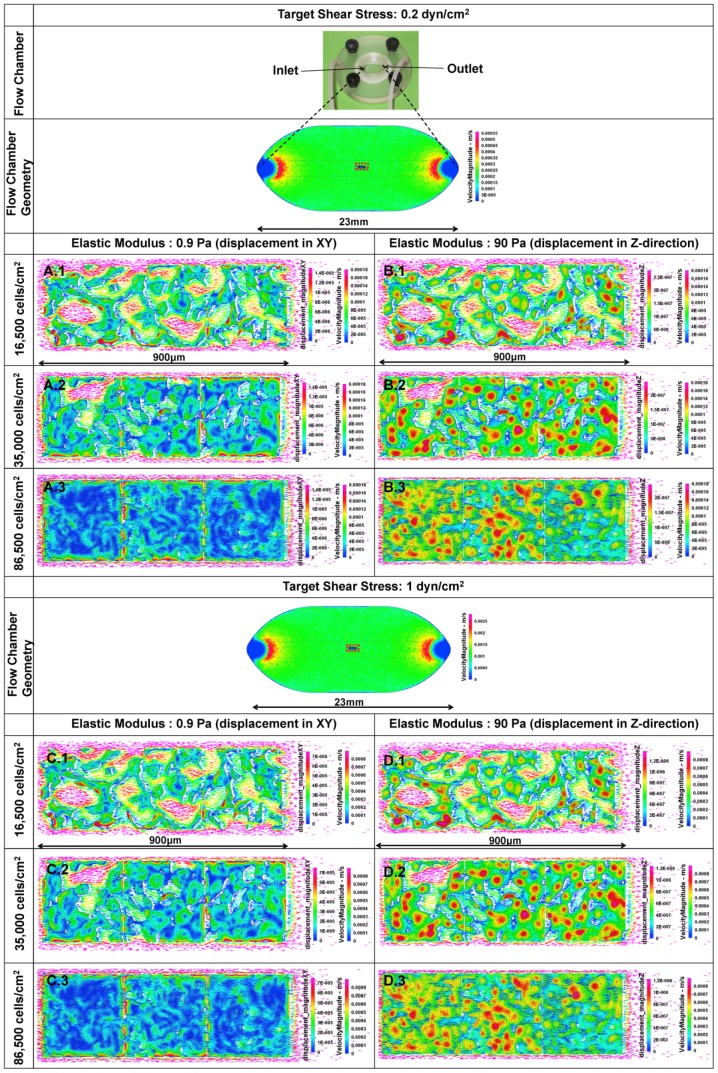
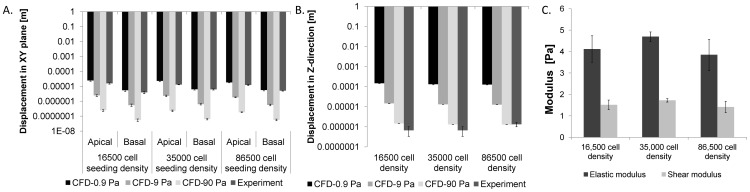
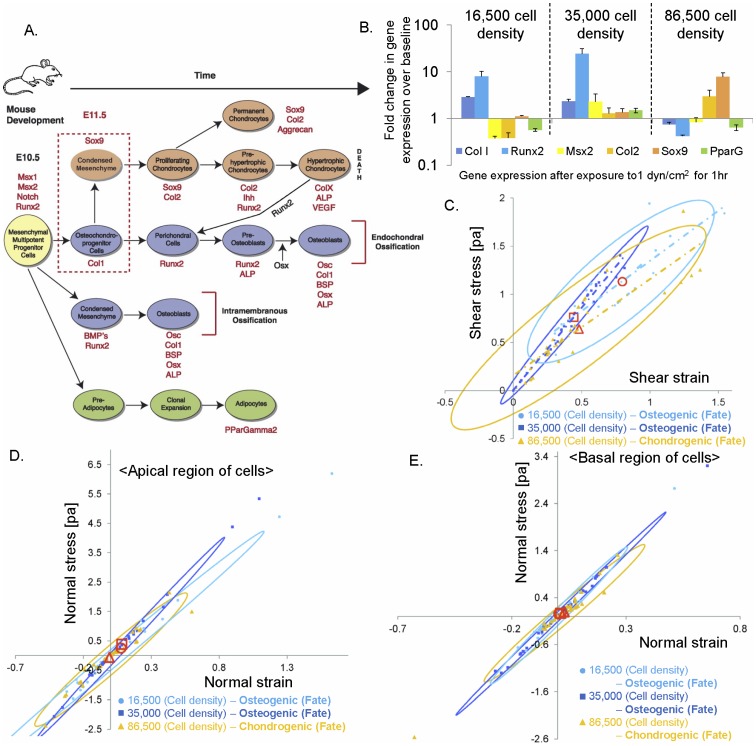
During mesenchymal condensation, the initial step of skeletogenesis, transduction of minute mechanical forces to the nucleus is associated with up or down-regulation of genes, ultimately resulting in formation of the skeletal template and appropriate cell lineage commitment. The summation of these biophysical cues affects the cell's shape and fate. Here, we predict and measure surface strain, in live stem cells, in response to controlled delivery of stresses, providing a platform to direct short-term structure--function relationships and long-term fate decisions. We measure local strains on stem cell surfaces using fluorescent microbeads coated with Concanavalin A. During delivery of controlled mechanical stresses, 4-Dimensional (x,y,z,t) displacements of the bound beads are measured as surface strains using confocal microscopy and image reconstruction. Similarly, micro-particle image velocimetry (μ-piv) is used to track flow fields with fluorescent microspheres. The measured flow velocity gradient is used to calculate stress imparted by fluid drag at the surface of the cell. We compare strain measured on cell surfaces with those predicted computationally using parametric estimates of the cell's elastic and shear modulus. Finally, cross-correlating stress--strain data to measures of gene transcription marking lineage commitment enables us to create stress--strain--fate maps, for live stem cells in situ. The studies show significant correlations between live stem cell stress--strain relationships and lineage commitment. The method presented here provides a novel means to probe the live stem cell's mechanome, enabling mechanistic studies of the role of mechanics in lineage commitment as it unfolds.


Conflict of interest statement

Competing Interests: The authors have declared that no competing interests exist.

Figures

Figure 1
Figure 1. Characteristic magnitudes and time domains of mechanical signals applied in studies of multipotent cell differentiation.
Each data point represents one study. The shape of the data point portrays the lineage to which the multipotent cell committed. Blue data points depict deviatoric (shape changing) stresses, i.e. shear stress magnitudes [dyn/cm2], and duration of signal over the time course of the study [days]. Red data points depict dilatational stresses (volume changing stresses, i.e. hydrostatic compression and tension, [log10Pa]). The yellow plane (opaque to transparent reflecting respective likelihood of the stress ranges) overlay represents dilatational and deviatoric stress ranges predicted during cell fate determination in utero , , –.
Figure 2
Figure 2. In situ mapping of stem cell stresses and strains.
4D (x,y,z,t) image of microsphere displacements (A, C, E) and microbead displacements (B, D, F) shows flow fields and surface strains, respectively, in live stem cells subjected to fluid flow at low (A,B), high (C,D), and very high (E,F) densities. Calcein Green stains live cells. Red and white arrows indicate velocity of flow (microsphere displacement and direction: A, C, E) and strain (microbead displacements: B, D, F), respectively. Red, green, and white dots (B, D, F) show respective microbead positions at 0, 30, and 60 minutes after flow. Stresses imparted by flow at cell surfaces are calculated from the experimentally determined velocity gradient (slope of Fig. S1, Equation 3). Cell surface strains (deformations) are calculated using experimentally measured microbead displacements on cell surfaces.
Figure 3
Figure 3. Computational predictions (CFD-FEM) of strains on cell surfaces for flow rates imparting 0.2 (A,B) and 1 dyn/cm2 (C,D).
Each computational prediction includes velocity magnitude and displacement in XY plane, assuming an elastic modulus of 0.9 Pa (A and C), and in the Z direction, assuming an elastic modulus of 90 Pa (B and D) at 16,500 cells/cm2 (1); computational predictions were carried out for 35,000 cells/cm2 (2), and 86,500 cells/cm2 (3) cell seeding densities. Topological color map indicates displacements on surface of seeded cells. The geometry of the seeded cells is imported from a 3D reconstruction of confocal images. Color arrows show flow velocity (flow field) in the near the vicinity of cells.
Figure 4
Figure 4. Mechanical testing (stress - strain analysis) of live stem cells using novel microbead tracking method.
Cell surface deformation (strain) is mapped in situ concomitant to delivery of controlled mechanical cues via fluid flow. (A) Two dimensional (2D) images of microsphere displacements on cell surfaces. Calcein green stain marks live stem cells. Red, green, and blue dots indicate respective positions of microbeads at 0, 30, and 60 minutes after flow application. Control shows positions of microbeads in absence of flow. (B) Schematic depiction of flow and non-flow orientation/direction with respect to initial position of microbead (t0, red). (C) Comparison of microbead displacements on cell surfaces from control cohorts and cohorts exposed to flow. Error bars show standard errors (n = 3), * indicates statistical significance (p<0.05).
Figure 5
Figure 5. Experimental and computational analysis of flow regimes around live stem cells.
(A) 2D micrographs of μ-PIV experiments show flow regimes in the apical and basal regions of the live stem cell (target shear stress imparted by flow: 0.2 dyn/cm2). (B,C) Validated computational fluid dynamics (CFD) predictions of velocity gradients (which drive shear gradients and hence target shear stresses) in the apical and basal regions of cells, at flow rates including 0.2 and 1 dyn/cm2, respectively. * indicates statistical significance, defined by p<0.05. Error bars show standard errors (n = 3).
Figure 6
Figure 6. Parametric estimation of the stem cell's mechanical properties.
Displacements in the XY plane (A) and Z direction (B) were predicted computationally, using values varied parametrically (by orders of magnitude) about a known measured value for osteoblasts (900 Pa). By comparing experimentally measured displacements with displacements predicted for model cells with estimated moduli, a best estimate for the elastic and shear moduli of the model stem cell line could be made. The vertical axes are depicted in a logarithmic scale. C. Through linear interpolation, parametric estimates were made for elastic and shear modulus of the model stem cell, for flow generating a target shear of 1 dyn/cm2 and for three seeding conditions (different densities). Error bars show standard errors (n = 3).
Figure 7
Figure 7. Stress - strain - fate plots to probe the live stem cell's mechanome, in a case study in live stem cells exposed to 1 dyn/cm2 shear stress via fluid flow.
(A) After mesenchymal condensation (red dotted box, E11.5 in the mouse), the first step in skeletogenesis, stem cells follow lineage commitment paths toward chondrogenic (orange), osteogenic (blue), and adipogenic (green) fates. Transcription levels for specific proteins (red text) give a “chronological fingerprint” for each stage of development over time . (B) For live stem cells exposed to 1 dyn/cm2 shear stress over 60 minutes, rtPCR data provide fold changes in gene expression of markers above or below baseline (no flow exposure) gene expression levels, based on analysis of previously reported data . (C) Stress - strain - fate plot of live stem cells exposed to 1 dyn/cm2 shear stress over 60 minutes, where fate is indicated by color (osteogenic: blue, chondrogenic: orange). Linear regression of experimental data shows distinct slopes for each density and resultant fates, including osteogenic (blue: 1.04 [Pa], R2∼0.7, 16,500 cell density [cells/cm2]; navy: 0.9997 [Pa], R2∼0.78, 35,000 cell density [cells/cm2]), and chondrogenic lineage commitment (orange, 1.7124 [Pa], R2>0.8, 86,500 cell density [cells/cm2]). Red overlay shapes indicate mean strain stress at each density. Ellipses show 95% density area for each density. D. Local (apical), normal stress-strain (XY plane) relationship, depicting lineage commitment, including osteogenic (blue: 3.8513 [Pa] at 16,500 cell density [cells/cm2]; navy: 4.8513 [Pa] at 35,000 cell density [cells/cm2]) and chondrogenic lineages (orange: 3.8525 [Pa] at 86,500 cell density [cells/cm2]); all R2>0.8. Red shapes indicate mean stress and strain at each density. Ellipses indicate 95% density area for each density. E. Local (basal), normal stress-strain (XY plane) relationship, depicting lineage commitment, including osteogenic (blue: 4.9413 [Pa] at 16,500 cell density [cells/cm2]; navy: 4.8059 [Pa] at 35,000 cell density [cells/cm2]) and chondrogenic lineages (orange: 4.0653 [Pa] at 86,500 cell density [cells/cm2]); all R2>0.8. Each data point is shown from cohorts of cells in the field of view.

Similar articles

Cited by

References

    1. Knothe Tate ML, Falls TD, McBride SH, Atit R, Knothe UR (2008) Mechanical modulation of osteochondroprogenitor cell fate. Int J Biochem Cell Biol 40: 2720–2738. - PMC - PubMed
    1. Knothe Tate ML, Dolejs S, Miller RM, Knothe UR (2010) Role of mechanical loading in healing of massive bone autografts. J Orthop Res 28: 1657–1664. - PubMed
    1. Zimmerman J, Knothe Tate ML (2011) Structure - function relationships in the stem cell's mechanical world A: Seeding protocols as a means to control shape and fate in live cells. Mol Cell Biomech 8: 275–296. - PubMed
    1. Chang H, Knothe Tate ML (2011) Structure - function relationships in the stem cell's mechanical world B: Emergent anisotropy of the cytoskeleton correlates to volume and shape changing stress exposure. Mol Cell Biomech 8: 297–318. - PMC - PubMed
    1. Anderson EJ, Knothe Tate ML (2007) Design of tissue engineering scaffolds as delivery devices for mechanical and mechanically modulated signals. Tissue Eng 13: 2525–2538. - PubMed

Publication types