. 2012;7(9):e43632.
doi: 10.1371/journal.pone.0043632. Epub 2012 Sep 10.

Novel levamisole derivative induces extrinsic pathway of apoptosis in cancer cells and inhibits tumor progression in mice

Affiliations

Novel levamisole derivative induces extrinsic pathway of apoptosis in cancer cells and inhibits tumor progression in mice

Mahesh Hegde et al. PLoS One. 2012.

Abstract

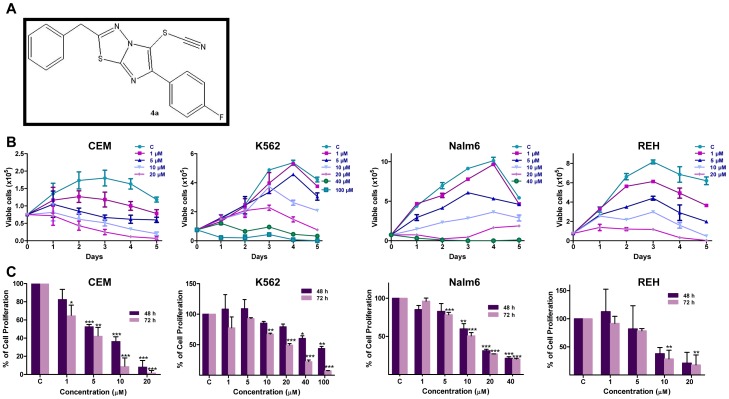
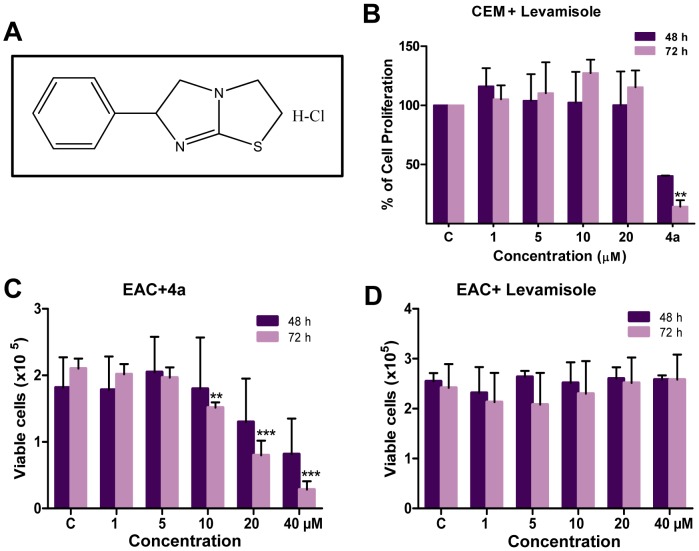
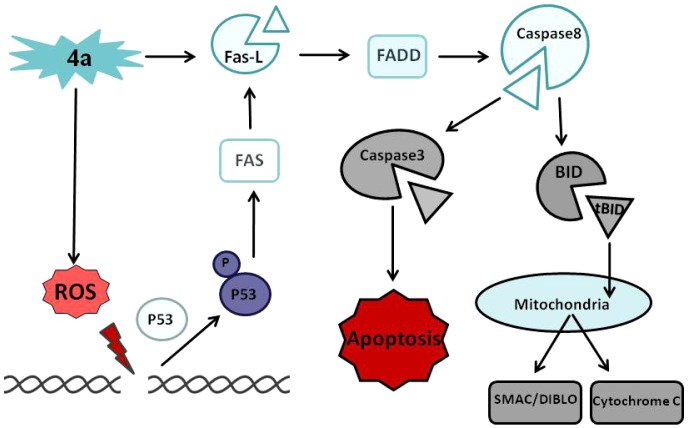
Background: Levamisole, an imidazo(2,1-b)thiazole derivative, has been reported to be a potential antitumor agent. In the present study, we have investigated the mechanism of action of one of the recently identified analogues, 4a (2-benzyl-6-(4'-fluorophenyl)-5-thiocyanato-imidazo[2,1-b][1], [3], [4]thiadiazole).

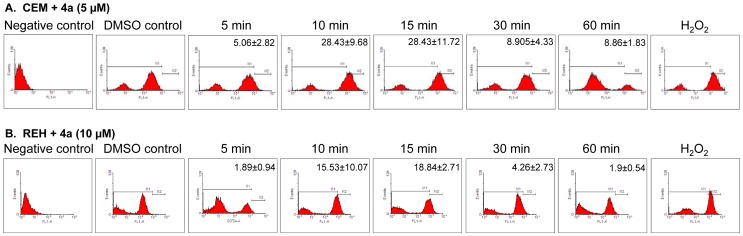
Materials and methods: ROS production and expression of various apoptotic proteins were measured following 4a treatment in leukemia cell lines. Tumor animal models were used to evaluate the effect of 4a in comparison with Levamisole on progression of breast adenocarcinoma and survival. Immunohistochemistry and western blotting studies were performed to understand the mechanism of 4a action both ex vivo and in vivo.

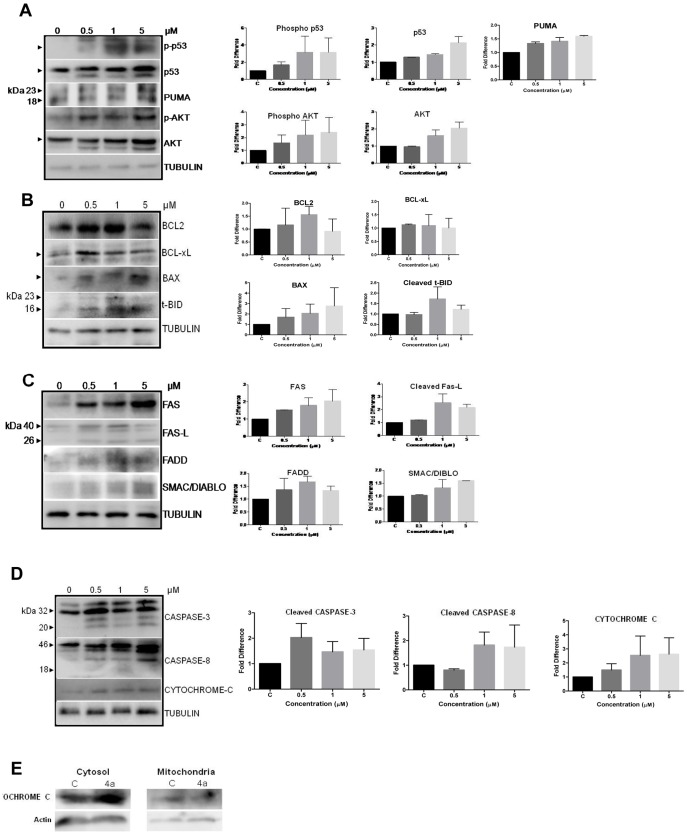
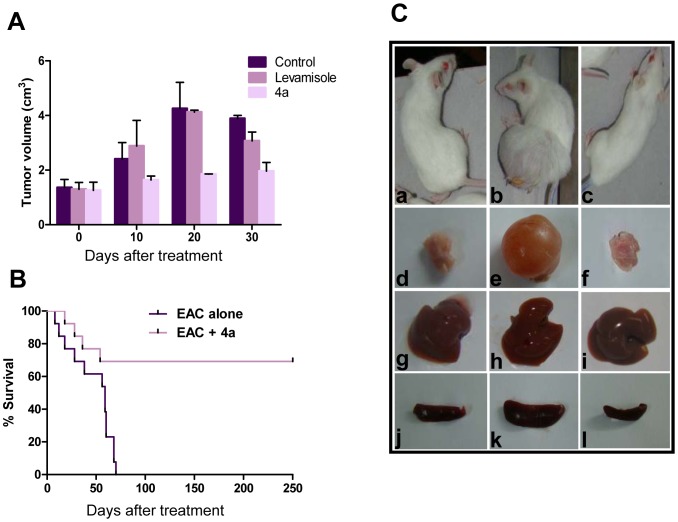
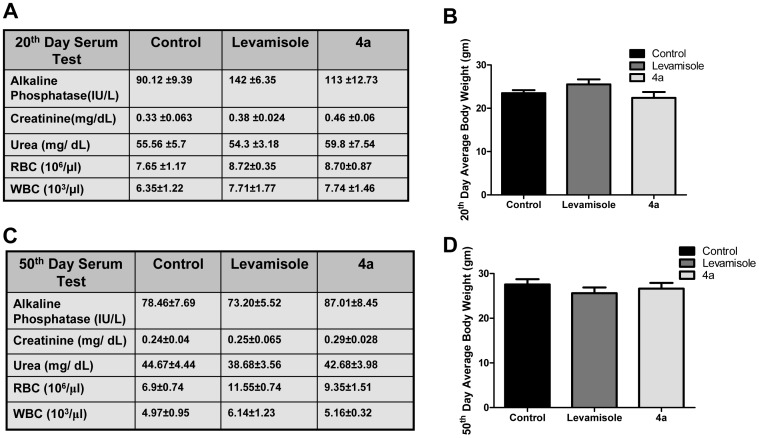
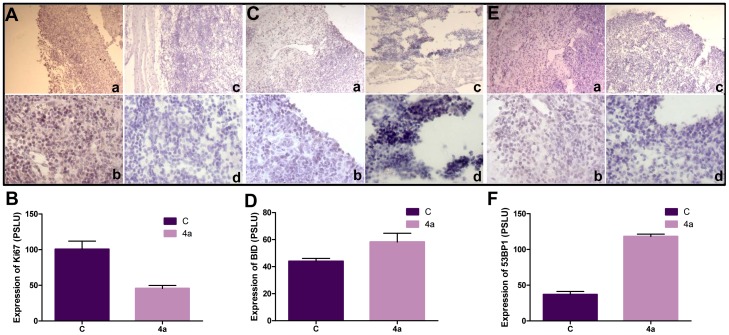
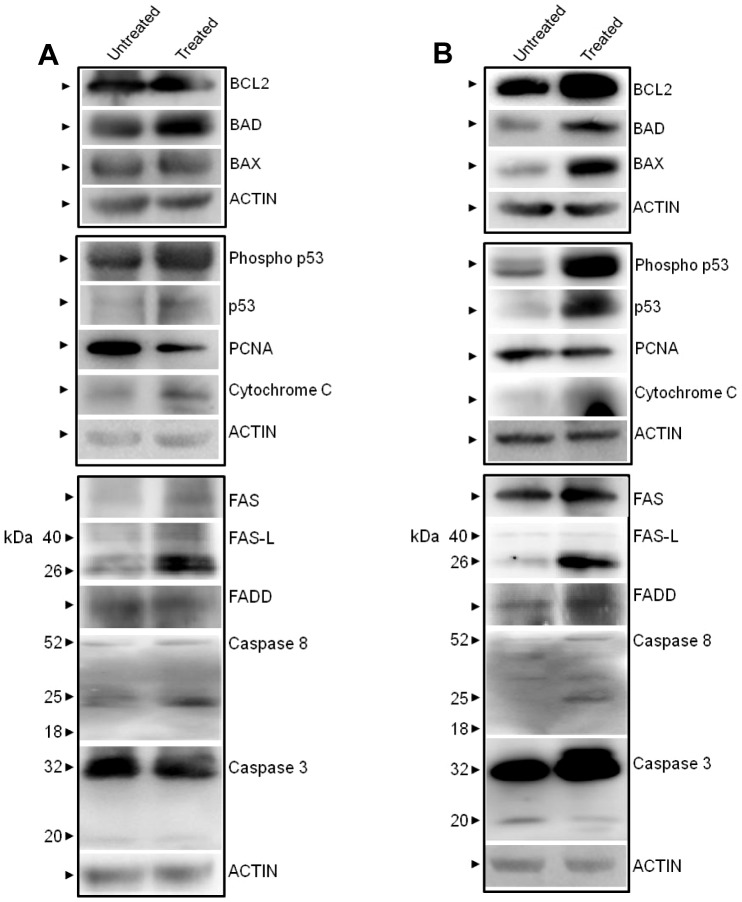
Results: We have determined the IC(50) value of 4a in many leukemic and breast cancer cell lines and found CEM cells most sensitive (IC(50) 5 µM). Results showed that 4a treatment leads to the accumulation of ROS. Western blot analysis showed upregulation of pro-apoptotic proteins t-BID and BAX, upon treatment with 4a. Besides, dose-dependent activation of p53 along with FAS, FAS-L, and cleavage of CASPASE-8 suggest that it induces death receptor mediated apoptotic pathway in CEM cells. More importantly, we observed a reduction in tumor growth and significant increase in survival upon oral administration of 4a (20 mg/kg, six doses) in mice. In comparison, 4a was found to be more potent than its parental analogue Levamisole based on both ex vivo and in vivo studies. Further, immunohistochemistry and western blotting studies indicate that 4a treatment led to abrogation of tumor cell proliferation and activation of apoptosis by the extrinsic pathway even in animal models.

Conclusion: Thus, our results suggest that 4a could be used as a potent chemotherapeutic agent.


Conflict of interest statement

Competing Interests: The authors have declared that there is no competing interest.

Figures

Figure 1
Figure 1. Dose-dependent cytotoxic effect of 4a on leukemic cell lines.
A. The structure of 4a. B. 4a induced cytotoxicity as determined by trypan blue assay. CEM, K562, Nalm6 and REH cells were cultured (0.75×10⁵ cells/ml) and cytotoxicity was measured after addition of increasing concentration of 4a as indicated. Cells were counted at intervals of 24 h until cells attained stationary phase and were plotted. DMSO treated cells were used as vehicle control. Standard error was calculated based on minimum of two independent experiments. C. Determination of cell proliferation using MTT assay following addition of 4a to CEM, K562, Nalm6, and REH cells (48 and 72 h). Results shown are from a minimum of two independent experiments, each was done in duplicates and results are expressed as % of cell proliferation. In all panels “C” stands for DMSO treated vehicle control.
Figure 2
Figure 2. Comparison of cytotoxicity of 4a and Levamisole in CEM and EAC cells.
A. The structure of Levamisole, the parental compound of 4a. B. Determination of cell proliferation using MTT assay on CEM cells treated with Levamisole or 4a. In case of Levamisole, concentrations used were 1, 5, 10 and 20 µM, while it was 10 µM for 4a. Standard error was calculated based on two independent experiments. C, D. Cytotoxicity of 4a and Levamisole on EAC cells as measured by trypan blue assay. EAC cells were cultured (0.75×10⁵ cells/ml) and treated with 1, 5, 10, 20 and 40 µM of 4a or Levamisole. Viability of the cells were determined by trypan blue assay at 48 and 72 h. Standard error was calculated based on three independent experiments.
Figure 3
Figure 3. Determination of intracellular ROS production in CEM and REH cells following treatment with 4a.
A, B. CEM (A) and REH (B) cells treated with 4a (5 µM and 10 µM, respectively) for different time points were used for testing the formation of intracellular ROS by flow cytometry analysis. The concentration selected for the study was based on their respective IC50 values. H2O2 treated cells were used as positive control while cells alone were used as negative control. DMSO treated cells were used as vehicle control. Cell population showing ROS was shown along with standard error mean (n = 2).
Figure 4
Figure 4. Expression of apoptotic proteins in CEM cells after 4a treatment.
CEM cell lysate was prepared following treatment with 4a (0, 0.5, 1 and 5 µM for 48 h). DMSO treated cells were used as control (0 µM). Western blotting studies were performed using specific primary and secondary antibodies for expression of (A) Phospho p53, p53, PUMA, phospho AKT, AKT (B) BCL2, BCL-xL, BAX and t-BID; (C) FAS, FAS-L, FADD, and SMAC/DIABLO (D) CASPASE-3, CASPASE-8 and CYTOCHROME C. α-TUBULIN was used as loading control. The quantification of the bands in each blot shown in left panel is shown as bar diagram with standard error based on two independent experiments following normalization with respective TUBULIN E. Release of CYTOCHROME C from mitochondria after treatment with 4a. Mitochondrial as well as cytosolic fractions were separated from CEM cells after 48 h of treatment with 4a (5 µM), DMSO treated cells were used as control (C), western blotting was performed using anti-CYTOCHROME C. Actin was used as loading control.
Figure 5
Figure 5. Comparison of effect of 4a and Levamisole on progression of solid tumor in mice.
Solid tumor was induced in Swiss albino mice by injecting EAC cells. Six doses of 4a and Levamisole (20 mg/kg) each administered to tumor bearing mice on every alternate day from 12th day of EAC cell injection. A. Effect of 4a and Levamisole on tumor progression at different time points. Data shown is based on two independent batches of experiments containing four animals each. Error bars indicate SD from independent experiments. B. Kaplan–Meier survival curves of mice treated with 4a. Out of 24 tumor induced Swiss Albino animals, 12 were treated with 4a (20 mg/kg) and survival graph was plotted, Log-rank statistical test showed P<0.005 (**). In control case, median survival time was found to be 59 days and in case of 4a treated it is undefined (value showed up to 250 days). C. Gross appearance of 4a treated and untreated tumor mice and their selected organs at 25th day of treatment. a. mouse with no tumor, b. mouse bearing tumor, c. tumor bearing mouse after treatment with 4a, d. thigh tissue of normal mouse, e. tumor, f. thigh tissue of a treated mouse, g. liver from normal mouse, h. liver of a tumor mouse, i. liver from a 4a treated mouse, j. spleen of a normal mouse, k. spleen of a mouse with tumor, l. spleen of a treated mouse.
Figure 6
Figure 6. Evaluation of side effects of Levamisole and 4a in Swiss Albino mice.
4a or Levamisole were orally administered (20 mg/kg, six doses in interval of two weeks) to experimental animals and body weight was monitored on 20th or 50th day, blood was collected and serum was checked for alkaline phosphatase (ALP), creatinine; urea, and plasma was used for counting RBCs and WBCs to analyze the side effects. A, C. Evaluation of kidney and liver function following 20 and 50 days, respectively, of 4a treatment. B, D. Assessment of body weight changes in mice following 20 and 50 days after 4a and Levamisole treatment. Value of serum tests and blood counts are given with mean±SEM (n = 6), average body weight of each group was plotted with standard error.
Figure 7
Figure 7. Immunostaining studies for apoptotic and DNA damage markers following treatment with 4a.
A–F. Ki67, BID and 53BP1 immunostaining of tumor and treated tissues. The images were quantified using ImageJ software and standard error was plotted using independent images. A, B. Antibody staining for Ki67 on 25th day tumor tissue (a, b) and tumor tissues treated with 4a (c, d) and their quantification. C, D. Immunostaining for BID on 25th day control tumor (a, b) and 4a treated tumor (c,d) and their quantification. E, F. 53BP1 staining on 25th day tumor tissue (a, b) and 4a treated tumor tissue (c, d) and their quantification. Magnification of images shown in panels a and c are 10×, while b and d are 20×.
Figure 8
Figure 8. Comparison of expression of apoptotic proteins in 4a treated solid and liquid tumors in mice.
A. 4a was orally administered to mice bearing solid tumor (6 doses, 20 mg/kg). Tumor tissues were collected after 25 days of 4a treatment; lysate was prepared and used for western blotting. B. Expression of apoptotic proteins following 4a treatment in liquid tumor. EAC cells were injected intraperitoneally in mice to generate liquid tumor. Following 4a treatment (6 doses, 20 mg/kg) tumor cells were collected, lysate was prepared and used for western blotting. Antibodies used were BCL2, BAD, BAX, Phospho p53, p53, PCNA, CYTOCHROME C, FAS, FAS-L, FADD, CASPASE-8 and CASPASE-3. Actin was used as loading control (A, B).
Figure 9
Figure 9. Proposed model for mechanism of 4a induced cytotoxicity by induction of apoptosis.
4a treatment resulted in production of ROS, thereby damaging the DNA, which in turn helped in upregulation and phosphorylation of p53, where it activated extrinsic pathway of apoptosis by activating FAS, cleavage of FAS-L. These activated death receptors resulted in the recruitment of adaptor proteins, FAS-associated death domain proteins (FADD), which recruits and aggregates CASPASE-8, thereby promoting its auto processing and activation. Activated CASPASE-8 cleaves BID into t-BID, which further facilitates in the release of CYTOCHROME C from mitochondria, further cleaving PROCASPASE-3 into the effector CASPASE-3 which leads to cell death.

Similar articles

Cited by

References

    1. Nambiar M, Kari V, Raghavan SC (2008) Chromosomal translocations in cancer. Biochim Biophys Acta 1786: 139–152. - PubMed
    1. Nickoloff JA, De Haro LP, Wray J, Hromas R (2008) Mechanisms of leukemia translocations. Curr Opin Hematol 15: 338–345. - PMC - PubMed
    1. Aplan PD (2005) “You break it, you fix it.”. Blood 105: 1843–1844. - PubMed
    1. Rowley JD (2001) Chromosome translocations: dangerous liaisons revisited. Nat Rev Cancer 1: 245–250. - PubMed
    1. Nambiar M, Raghavan SC (2011) How does DNA break during chromosomal translocations? Nucleic Acids Res 39: 5813–5825. - PMC - PubMed

Publication types

MeSH terms