. 2012;7(9):e44011.
doi: 10.1371/journal.pone.0044011. Epub 2012 Sep 6.

Automated reconstruction algorithm for identification of 3D architectures of cribriform ductal carcinoma in situ

Affiliations

Automated reconstruction algorithm for identification of 3D architectures of cribriform ductal carcinoma in situ

Kerri-Ann Norton et al. PLoS One. 2012.

Abstract

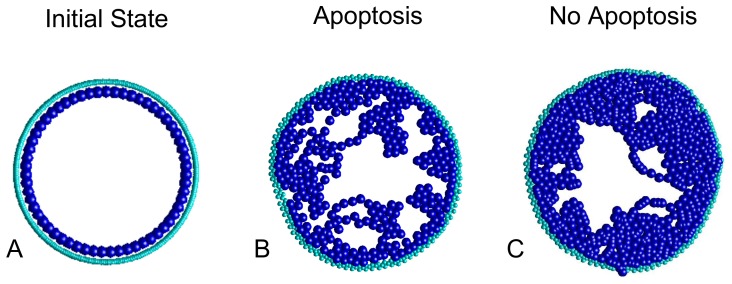
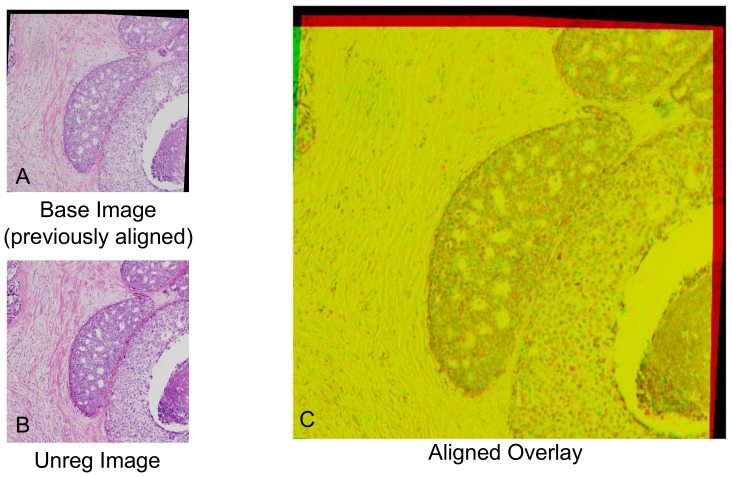
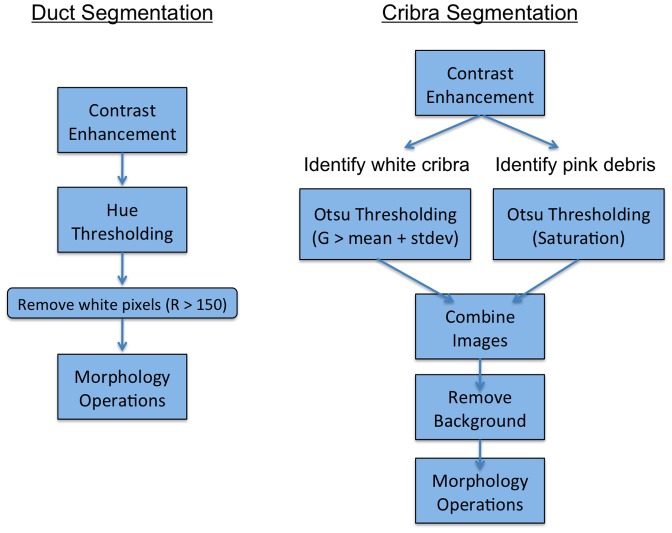
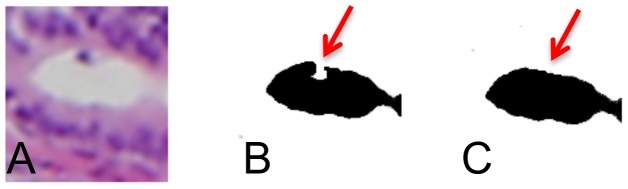
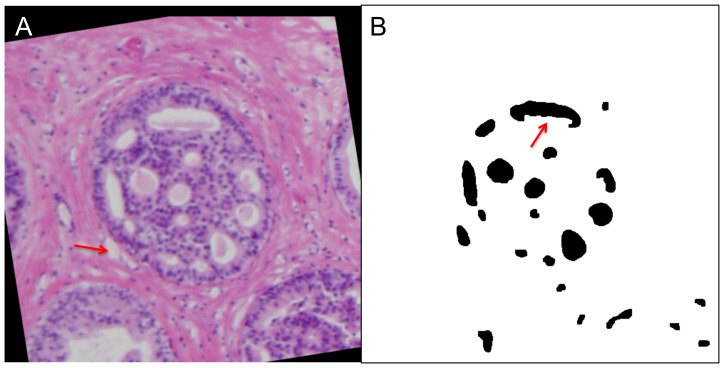
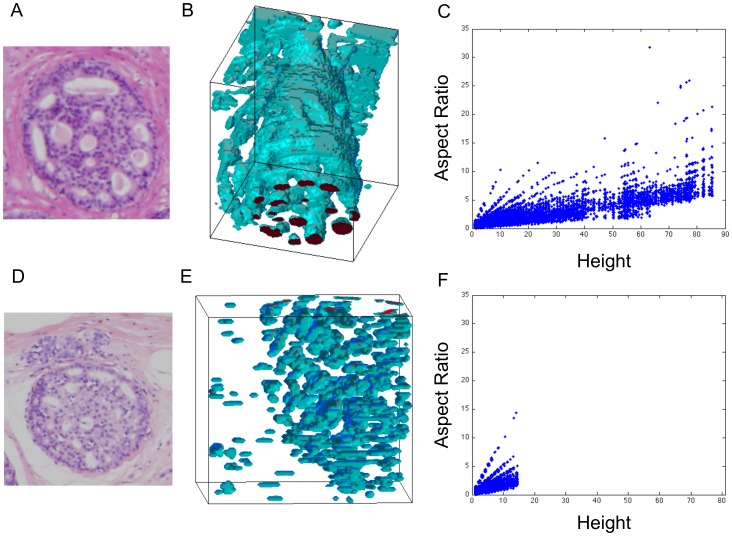
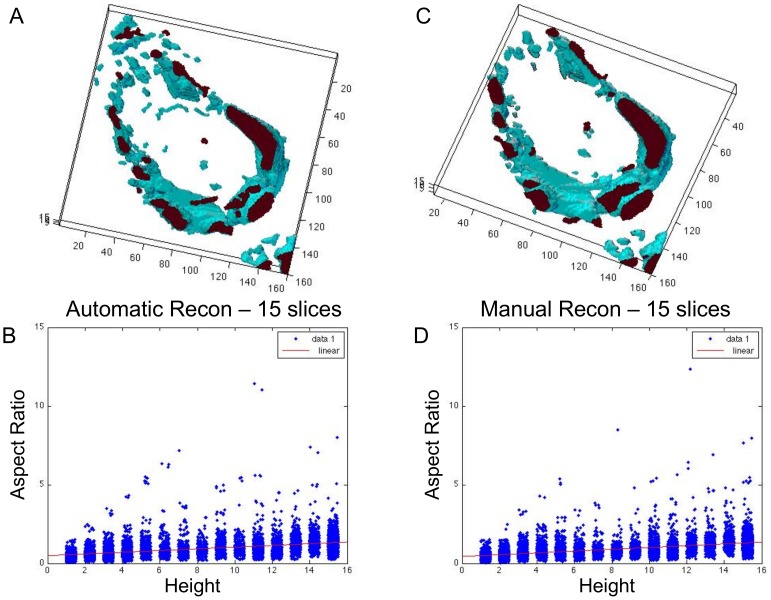
Ductal carcinoma in situ (DCIS) is a pre-invasive carcinoma of the breast that exhibits several distinct morphologies but the link between morphology and patient outcome is not clear. We hypothesize that different mechanisms of growth may still result in similar 2D morphologies, which may look different in 3D. To elucidate the connection between growth and 3D morphology, we reconstruct the 3D architecture of cribriform DCIS from resected patient material. We produce a fully automated algorithm that aligns, segments, and reconstructs 3D architectures from microscopy images of 2D serial sections from human specimens. The alignment algorithm is based on normalized cross correlation, the segmentation algorithm uses histogram equilization, Otsu's thresholding, and morphology techniques to segment the duct and cribra. The reconstruction method combines these images in 3D. We show that two distinct 3D architectures are indeed found in samples whose 2D histological sections are similarly identified as cribriform DCIS. These differences in architecture support the hypothesis that luminal spaces may form due to different mechanisms, either isolated cell death or merging fronds, leading to the different architectures. We find that out of 15 samples, 6 were found to have 'bubble-like' cribra, 6 were found to have 'tube-like' criba and 3 were 'unknown.' We propose that the 3D architectures found, 'bubbles' and 'tubes', account for some of the heterogeneity of the disease and may be prognostic indicators of different patient outcomes.


Conflict of interest statement

Competing Interests: The authors have declared that no competing interests exist.

Figures

Figure 1
Figure 1. Simulations of DCIS development.
A The initial duct starting from the original state of reproducing epithelial cells (blue) surrounded by myoepithelial sheath (cyan). Cribriform subtype is produced at B high reproductive rate with apoptosis, and C high reproductive rate without apoptosis (for simulation details, see: Norton et al., 2010).
Figure 2
Figure 2. Alignment Results (Sample dataset).
A “Base” image: 5th slice in sequence of paraffin-embedded exemplar specimen. The image has been previously aligned by comparison with 4th slice, as shown by comparison with black background. B “Unregistered” image: This is the 6th sequential slice from the same exemplar specimen. C Overlay comparison of base and registered image - formed by rotating and translating the unregistered image as described in text. The base image is shown in red, the registered image is shown in green. Most of the image is correctly aligned, as seen by the mostly yellow (red+green) overlay, and black again represents extra background introduced by alignment.
Figure 3
Figure 3. Duct and Cribra Segmentation Flowchart.
On the left, we show the general layout of the duct segmentation. We use contrast enhancement to ‘normalize’ each image to account for differences in staining that may occur for each slice. Thresholding is used to binarize the image. Hue segmentation can result in white pixels of the background to be picked up as duct, thus we remove them. Morphology operations are used to smooth the duct segmentations and remove minor artifacts. On the right, we show the layout of the cribra segmentation method. We use contrast enhancement to ‘normalize’ each image and better delineate the cribra. We use thresholding to binarize the image and identify ‘white’ cribra and ‘pink’ debris. These segmentations are combined and the background outside of the duct region is removed. Morphology operations are used to smooth the duct segmentations and remove minor artifacts.
Figure 4
Figure 4. Crescent Issue.
A An example cribra compared with an illustrative B cribra segmentation. Here is an example of the crescent issue (red arrow) that can occur before a closing operation, where the cribra is not a smooth surface but has a crescent-like gap. C This shows an illustration of how the closing operation can fix this type of issue.
Figure 5
Figure 5. Cribra Segmentation.
A Original aligned image, compared with B automatic cribra segmentation. Most of the cribra are completely identified but in some cases some of the cribra is absent or incomplete, see red arrow in B. In other cases there are false cribra but these are small and few in number. In A the red arrow indicates a fat globule that can be incorrectly identified as a cribrum. This example has a Precision score of 81.1 and a Recall score of 82.0.
Figure 6
Figure 6. Exemplars of Bubbles and Tubes from Automatic Reconstructions.
A Example of a serial section showing the duct of interest, taken at 4×. B 3D reconstruction (99 sections) of corresponding microlumenal structure showing ‘tube-like’ architecture. C Plot of cribra height (in voxels) vs. aspect ratio from the 3D reconstruction. D Example of a serial section showing a duct of interest at 4×, note the similarity to panel A. E 3D reconstruction (80 sections) of corresponding microlumenal structure showing ‘bubble-like’ architecture. F Plot of cribra height (in voxels) vs. aspect ratio from the 3D reconstruction of the second specimen, note the clear differences in aspect ratios.
Figure 7
Figure 7. Automatic vs. Manual Segmentation.
A is the 3D reconstruction of 15 slices using the automatic segmentation algorithm. B shows the plot of the aspect ratio vs. height. C is the 3D reconstruction of 15 slices using manual segmentations. D shows the plot of the aspect ratio vs. the height for the manual reconstruction. Both quantitatively and visually the architectures of the reconstructions are consistent. The axes and heights are in voxels.

Similar articles

Cited by

References

    1. Cornfield DB, Palazzo JP, Schwartz GF, Goonewardene SA, Kovatich AJ, et al. (2004) The prognostic significance of multiple morphologic features and biologic markers in ductal carcinoma in situ of the breast: a study of a large cohort of patients treated with surgery alone. Cancer 100: 2317–2327. - PubMed
    1. Wiechmann L, Kuerer HM (2008) The molecular journey from ductal carcinoma in situ to invasive breast cancer. Cancer 112: 2130–2142. - PubMed
    1. Miller NA, Chapman JA, Qian J, Christens-Barry WA, Fu Y, et al. (2010) Heterogeneity Between Ducts of the Same Nuclear Grade Involved by Duct Carcinoma In Situ (DCIS) of the Breast. Cancer Inform 9: 209–216. - PMC - PubMed
    1. Kenny PA, Lee GY, Myers CA, Neve RM, Semeiks JR, et al. (2007) The morphologies of breast cancer cell lines in three-dimensional assays correlate with their profiles of gene expression. Mol Oncol 1: 84–96. - PMC - PubMed
    1. Wang F, Weaver VM, Petersen OW, Larabell CA, Dedhar S, et al. (1998) Reciprocal interactions between beta1-integrin and epidermal growth factor receptor in three-dimensional basement membrane breast cultures: a different perspective in epithelial biology. Proc Natl Acad Sci U S A 95: 14821–14826. - PMC - PubMed

Publication types