. 2012;7(9):e44113.
doi: 10.1371/journal.pone.0044113. Epub 2012 Sep 6.

Decrease of peripheral and intestinal NKG2A-positive T cells in patients with ulcerative colitis

Affiliations

Decrease of peripheral and intestinal NKG2A-positive T cells in patients with ulcerative colitis

Takehiko Katsurada et al. PLoS One. 2012.

Abstract

To investigate the role of inhibitory natural killer receptors (iNKRs) in inflammatory bowel disease (IBD), we analyzed the expression of NKG2A, one of the iNKRs, on T cells in a mouse colitis model and human IBD. During the active phase of dextran sulfate sodium (DSS)-induced mouse colitis, the frequency of NKG2A+ T cells was significantly decreased in the peripheral blood, and increased in the intestine, suggesting the mobilization of this T cell subset to the sites of inflammation. Administration of anti-NKG2A antibody increased the number of inflammatory foci in DSS-induced colitis, suggesting the involvement of NKG2A+ T cells in this colitis model. In ulcerative colitis (UC) patients, the frequency of peripheral blood NKG2A+ T cells was significantly decreased, compared with Crohn's disease (CD) patients and healthy controls, regardless of clinical conditions such as treatment modalities and disease activity. Notably, in sharp contrast to the DSS-induced mouse colitis model, the frequency of NKG2A+ cells among intestinal T cells was also decreased in UC patients. These results suggest that inadequate local infiltration of NKG2A+ T cells may be involved in the pathogenesis of UC.


Conflict of interest statement

Competing Interests: The authors have declared that no competing interests exist.

Figures

Figure 1
Figure 1. Frequency of NKG2A+ T cells in DSS-induced colitis mice.
A) Body weight was measured chronologically. B) The frequency of NKG2A+ T cells in PBMCs was analyzed by flow cytometry. Data were calculated as the ratio of NKG2A+CD3+ cells to CD3+ cells. ▪, DSS-induced colitis mice; ▵, control mice. For both DSS-induced colitis and control mice, 3 to 10 mice were subjected to analysis at each time point. *P<0.05.
Figure 2
Figure 2. Frequency of NKG2A+ T cells in the peripheral blood and intestine of DSS-induced colitis mice.
A) Frequency of NKG2A+ T cells in PBMCs of DSS-induced colitis mice. B) Frequency of NKG2A+ T cells in LPMCs of DSS-induced colitis mice. Data are expressed as the ratio of NKG2A+CD3+ cells to CD3+ cells. For each time point, 8 or 9 mice were subjected to analysis. *P<0.05.
Figure 3
Figure 3. Frequency of NKG2A+ T cells in LPMCs isolated from the intestine of DSS-induced colitis mice.
Frequencies of CD8+ T cells in CD3+ LPMCs (A), TCRγδ+ T cells in CD3+ LPMCs (B), CD49b+ T cells in CD3+ LMPCs (C), NKG2A+ cells in CD3+CD8+ LPMCs (D), NKG2A+ cells in CD3+TCRγδ+ LPMCs (E), and NKG2A+ cells in CD3+CD49b+ LPMCs (F) were analyzed by flow cytometry. For each time point, 4 to 7 mice were subjected to analysis. *P<0.05.
Figure 4
Figure 4. Frequency of inflammatory foci in the intestine of DSS-induced colitis mice treated with anti-NKG2A Ab or control IgG.
For Ab blocking experiments, mice were intraperitoneally injected with 300 µg of anti-NKG2A monoclonal Ab or control IgG. The number of inflammatory foci in the intestine was counted histologically on day 6 after DSS administration. Seven mice injected with anti-NKG2D Ab and 8 mice injected with control IgG were subjected to analysis.
Figure 5
Figure 5. NKG2A+ T cells in the peripheral blood of HCs and IBD patients.
A) Representative flow cytometry analysis of peripheral blood NKG2A+ T cells in HC and IBD patients. B) The ratio of NKG2A+CD3+ cells to CD3+ PBMCs was analyzed by flow cytometry. PBMCs from 23 HCs, 20 patients with UC, and 16 patients with CD were subjected to analysis. Numbers in parentheses represent mean ± standard deviation. *P<0.05.
Figure 6
Figure 6. Frequency of NKG2A+ T cells in PBMCs of UC patients subgrouped according to clinical conditions.
Data are expressed as the ratio of NKG2A+CD3+ cells to CD3+ cells. Clinical data are summarized in Table 1. Numbers in parentheses represent mean ± standard deviation.
Figure 7
Figure 7. Frequency of NKG2A+ T cells and NKG2A+ NK cells in PBMCs from UC patients, CD patients, and healthy controls.
A) Ratio of NKG2A+ cells in CD3+CD8+ T cells, B) Ratio of NKG2A+ cells in CD3+CD56+ NKT cells, C) Ratio of NKG2A+ cells in CD3+TCRγδ+ T cells, and D) Ratio of NKG2A+ cells in CD3-CD56+ NK cells. Numbers in parentheses represent mean ± standard deviation. PBMCs isolated from 23 HCs, 20 patients with UC, and 16 patients with CD were subjected to analysis. *P<0.05.
Figure 8
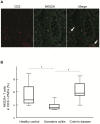
Figure 8. Frequency of NKG2A+ T cells in the intestine of UC patients.
A) A representative double-stained section of normal intestinal tissues using anti-CD3 and anti-NKG2A Abs. Merged images show double positive cells (arrow). Red, CD3; green, NKG2A. B) The frequency of NKG2A+ T cells in the intestine was analyzed by immunohistochemistry. NKG2A+ T cells in the lamina propria were less abundant in UC patients than in HC and CD patients. Tissue sections from 7 HCs, 6 UC patients, and 5 CD patients were subjected to analysis. *P<0.05.

References

    1. Podolsky DK (2002) Inflammatory bowel disease. N Engl J Med 347: 417–429. - PubMed
    1. Fiocchi C (1998) Inflammatory bowel disease: etiology and pathogenesis. Gastroenterology 115: 182–205. - PubMed
    1. Abraham C, Cho JH (2009) Inflammatory bowel disease. N Engl J Med 361: 2066–2078. - PMC - PubMed
    1. Moretta A, Bottino C, Mingari MC, Biassoni R, Moretta L (2002) What is a natural killer cell? Nat Immunol 3: 6–8. - PubMed
    1. Ljunggren HG, Karre K (1990) In search of the ‘missing self’: MHC molecules and NK cell recognition. Immunol Today 11: 237–244. - PubMed

Publication types

MeSH terms