. 2012;7(9):e44483.
doi: 10.1371/journal.pone.0044483. Epub 2012 Sep 7.

Technical reproducibility of genotyping SNP arrays used in genome-wide association studies

Affiliations

Technical reproducibility of genotyping SNP arrays used in genome-wide association studies

Huixiao Hong et al. PLoS One. 2012.

Abstract

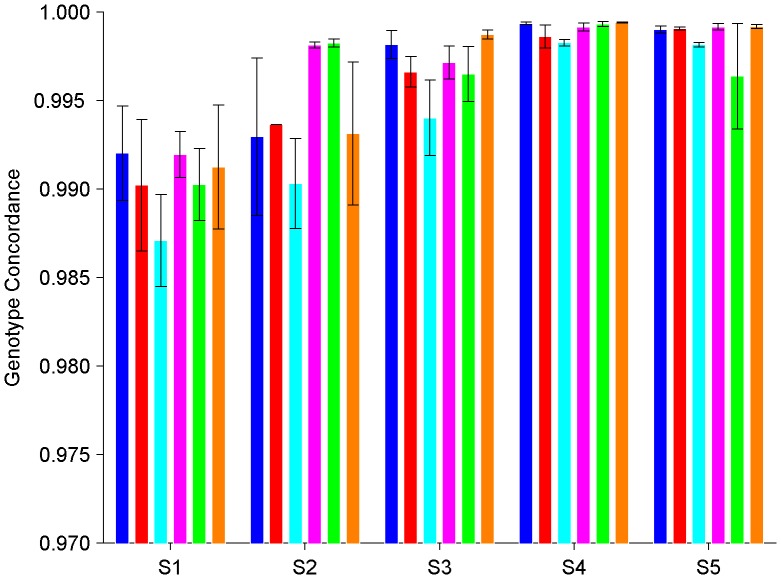
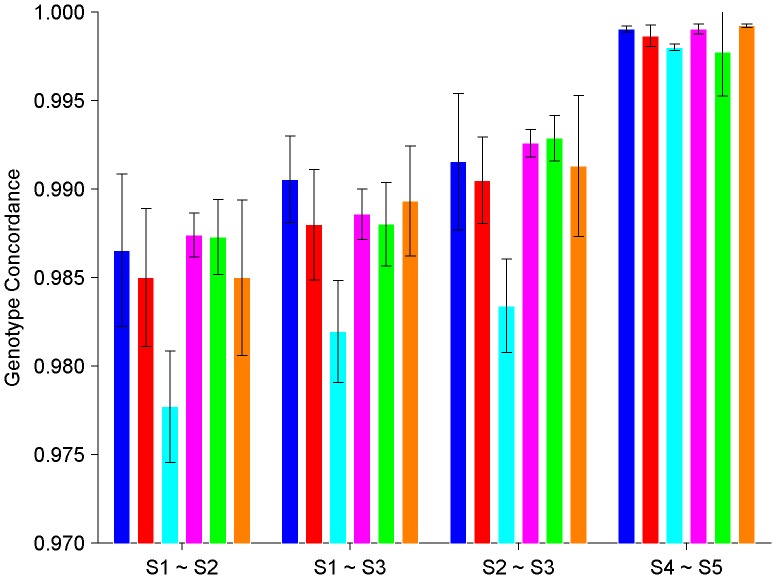
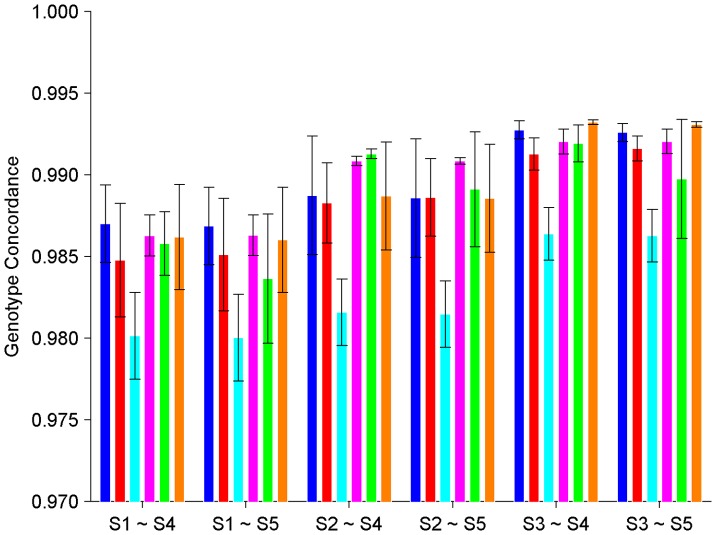
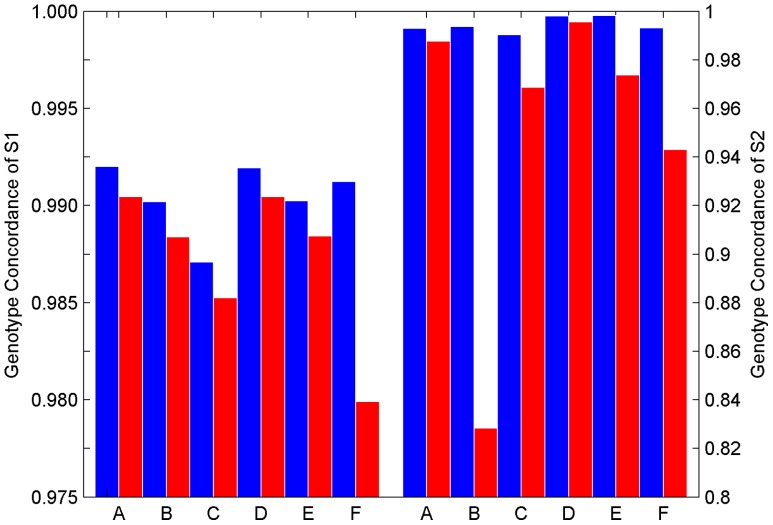
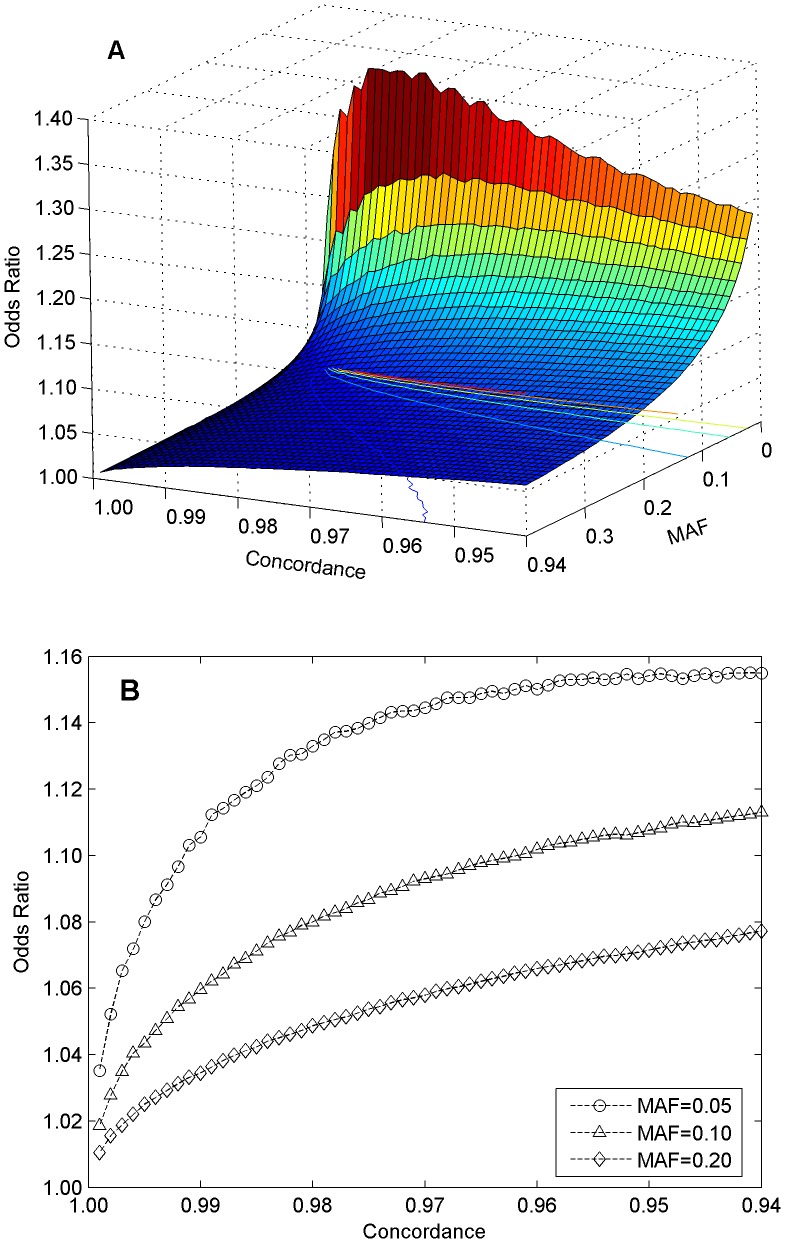
During the last several years, high-density genotyping SNP arrays have facilitated genome-wide association studies (GWAS) that successfully identified common genetic variants associated with a variety of phenotypes. However, each of the identified genetic variants only explains a very small fraction of the underlying genetic contribution to the studied phenotypic trait. Moreover, discordance observed in results between independent GWAS indicates the potential for Type I and II errors. High reliability of genotyping technology is needed to have confidence in using SNP data and interpreting GWAS results. Therefore, reproducibility of two widely genotyping technology platforms from Affymetrix and Illumina was assessed by analyzing four technical replicates from each of the six individuals in five laboratories. Genotype concordance of 99.40% to 99.87% within a laboratory for the sample platform, 98.59% to 99.86% across laboratories for the same platform, and 98.80% across genotyping platforms was observed. Moreover, arrays with low quality data were detected when comparing genotyping data from technical replicates, but they could not be detected according to venders' quality control (QC) suggestions. Our results demonstrated the technical reliability of currently available genotyping platforms but also indicated the importance of incorporating some technical replicates for genotyping QC in order to improve the reliability of GWAS results. The impact of discordant genotypes on association analysis results was simulated and could explain, at least in part, the irreproducibility of some GWAS findings when the effect size (i.e. the odds ratio) and the minor allele frequencies are low.


Conflict of interest statement

Competing Interests: The authors have read the journal’s policy and have the following conflicts: Wendell Jones is a paid employee of Expression Analysis, Inc; Wendy Czika, Kelci Miclaus and Russell D. Wolfinger are employed by SAS Institute Inc; Zhenqiang Su and Hong Fang are employed by ICF International Company at NCTR/FDA (National Center for Toxicological Research/Food and Drug Administration); Christophe G. Lambert is a paid employee of Golden Helix Inc; Silvia Vega has been employed by Rosetta BioSoftware and for Microsoft Corp. in the last five years but at present has no competing interests. All other authors have no competing interests. This does not alter the authors’ adherence to all the PLOS ONE policies on sharing data and materials.

Figures

Figure 1
Figure 1. Concordance in genotypes between replicates of the same subject within a genotyping platform and within a genotyping experiment.
The averaged concordance values (the bars) and the corresponding standard deviations (the error bars) between replicates of a subject (coded by color as: blue for A, red for B, cyan for C, Magenta for D, Green for E, and Orange for F) genotyped in a genotyping experiment (indicated at x-axis) are plotted. The subject codes and the experiment ID for genotyping experiments are listed in Table 1.
Figure 2
Figure 2. Concordance in genotypes between replicates of the same subject genotyped in two different experiments by using the same genotyping platform.
The averaged concordance values (the bars) and the corresponding standard deviations (the error bars) between replicates of a subject (coded by color as: blue for A, red for B, cyan for C, Magenta for D, Green for E, and Orange for F) genotyped at two genotyping experiments (indicated at x-axis) are plotted. The subject codes and the experiment ID for genotyping experiments are listed in Table 1.
Figure 3
Figure 3. Concordance in genotypes between replicates of the same subject genotyped by using different genotyping platforms.
The averaged concordance values (the bars) and the corresponding standard deviations (the error bars) between replicates of a subject (coded by color as: blue for A, red for B, cyan for C, Magenta for D, Green for E, and Orange for F) genotyped by using different genotyping platforms (indicated at x-axis) are plotted. The subject codes and the experiment ID for genotyping experiments are listed in Table 1.
Figure 4
Figure 4. Concordance in genotypes between replicates of the same subject within a genotyping platform and within a genotyping experiment for comparing with (blue bars) and without (red bars) removal of arrays of low quality.
The left panel is plotted for the data from genotyping experiment E1 while the right panel for genotyping experiment E2. The subject codes of the x-axis are listed in Table 1.
Figure 5
Figure 5. Simulations results.
Odds ratios were simulated for 50,000 times for each pair of a genotype concordance (from 0.94 to 1.00 with a step of 0.001) and a minor allele frequency (from 0.01 to 0.40 with a step of 0.01) by using a case population of 2,000 samples and a control sample size of 3,000 samples. Relationship between top 5% odds ratio of the 50,000 ones, concordance in genotypes, and minor allele frequency is depicted in A. The intersection curves at minor allele frequency values 0.05, 0.10, and 0.20 are shown in B.

References

    1. The International HapMap Consortium (2007) A second generation human haplotype map of over 3.1 million SNPs. Nature 449: 851–862. - PMC - PubMed
    1. Manolio TA, Brooks LD, Collins FS (2008) A HapMap harvest of insights into the genetics of common disease. J Clin Invest 118: 1590–1605. - PMC - PubMed
    1. Zeggini E, Weedon MN, Lindgren CM, Frayling TM, Elliott KS, et al. (2007) Replication of genome-wide association signals in UK samples reveals risk loci for type 2 diabetes. Science 316: 1336–1341. - PMC - PubMed
    1. Scott LJ, Mohlke KL, Bonnycastle LL, Willer CJ, Li Y, et al. (2007) A genome-wide association study of type 2 diabetes in Finns detects multiple susceptibility variants. Science 316: 1341–1345. - PMC - PubMed
    1. Sladek R, Rocheleau G, Rung J, Dina C, Shen L, et al. (2007) A genome-wide association study identifies novel risk loci for type 2 diabetes. Nature 445: 881–885. - PubMed