

Expression profiling of stem cell-related genes in neoadjuvant-treated gastric cancer: a NOTCH2, GSK3B and β-catenin gene signature predicts survival
- PMID: 22970250
- PMCID: PMC3438181
- DOI: 10.1371/journal.pone.0044566
Expression profiling of stem cell-related genes in neoadjuvant-treated gastric cancer: a NOTCH2, GSK3B and β-catenin gene signature predicts survival
Abstract
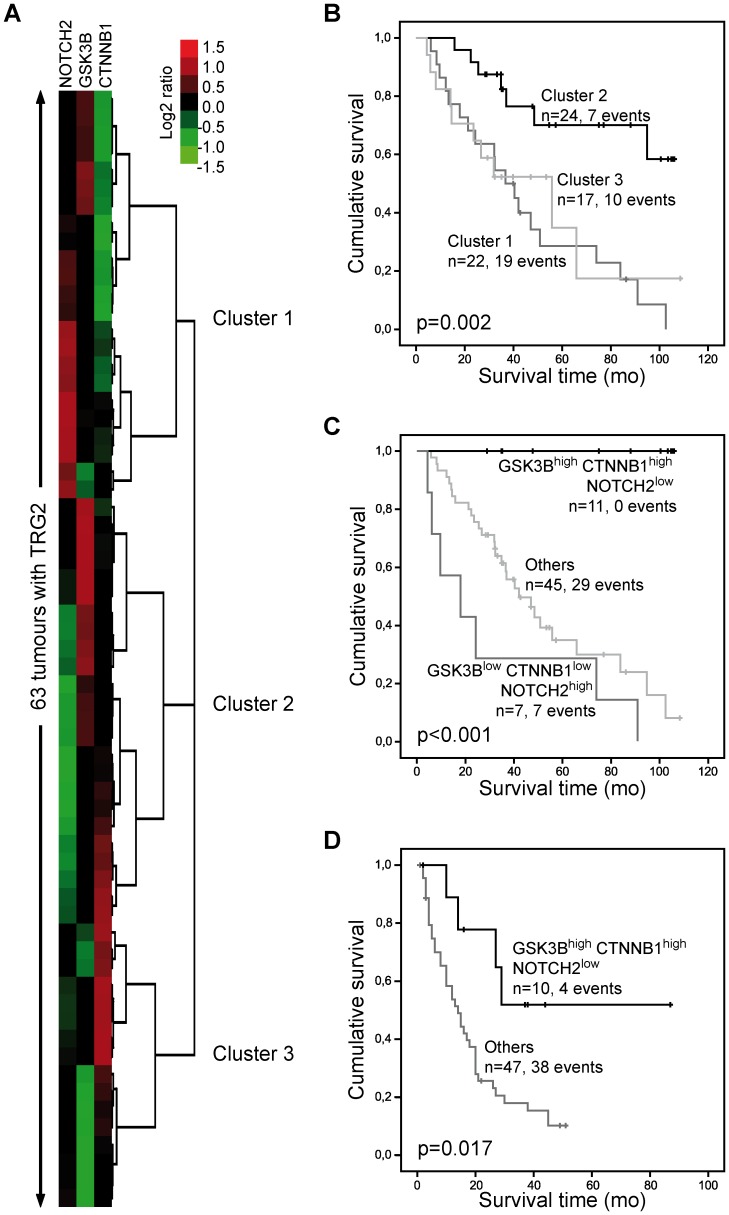
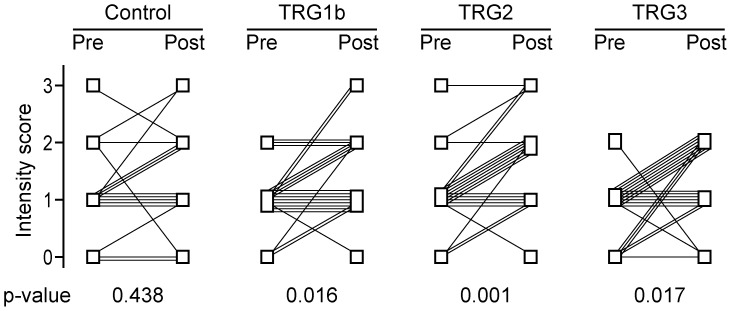
Cancer stem cell (CSC) based gene expression signatures are associated with prognosis in various tumour types and CSCs are suggested to be particularly drug resistant. The aim of our study was first, to determine the prognostic significance of CSC-related gene expression in residual tumour cells of neoadjuvant-treated gastric cancer (GC) patients. Second, we wished to examine, whether expression alterations between pre- and post-therapeutic tumour samples exist, consistent with an enrichment of drug resistant tumour cells. The expression of 44 genes was analysed in 63 formalin-fixed, paraffin embedded tumour specimens with partial tumour regression (10-50% residual tumour) after neoadjuvant chemotherapy by quantitative real time PCR low-density arrays. A signature of combined GSK3B(high), β-catenin (CTNNB1)(high) and NOTCH2(low) expression was strongly correlated with better patient survival (p<0.001). A prognostic relevance of these genes was also found analysing publically available gene expression data. The expression of 9 genes was compared between pre-therapeutic biopsies and post-therapeutic resected specimens. A significant post-therapeutic increase in NOTCH2, LGR5 and POU5F1 expression was found in tumours with different tumour regression grades. No significant alterations were observed for GSK3B and CTNNB1. Immunohistochemical analysis demonstrated a chemotherapy-associated increase in the intensity of NOTCH2 staining, but not in the percentage of NOTCH2. Taken together, the GSK3B, CTNNB1 and NOTCH2 expression signature is a novel, promising prognostic parameter for GC. The results of the differential expression analysis indicate a prominent role for NOTCH2 and chemotherapy resistance in GC, which seems to be related to an effect of the drugs on NOTCH2 expression rather than to an enrichment of NOTCH2 expressing tumour cells.
Conflict of interest statement
Figures
Similar articles
-
miR-181b/Notch2 overcome chemoresistance by regulating cancer stem cell-like properties in NSCLC.Stem Cell Res Ther. 2018 Nov 23;9(1):327. doi: 10.1186/s13287-018-1072-1. Stem Cell Res Ther. 2018. PMID: 30470250 Free PMC article.
-
5-Fluorouracil chemotherapy of gastric cancer generates residual cells with properties of cancer stem cells.Int J Biol Sci. 2015 Jan 21;11(3):284-94. doi: 10.7150/ijbs.10248. eCollection 2015. Int J Biol Sci. 2015. PMID: 25678847 Free PMC article.
-
Differential Notch1 and Notch2 expression and frequent activation of Notch signaling in gastric cancers.Arch Pathol Lab Med. 2011 Apr;135(4):451-8. doi: 10.5858/2009-0665-OA.1. Arch Pathol Lab Med. 2011. PMID: 21466361
-
Prognostic significance of leucine-rich-repeat-containing G-protein-coupled receptor 5, an intestinal stem cell marker, in gastric carcinomas.Gastric Cancer. 2016 Jul;19(3):767-77. doi: 10.1007/s10120-015-0543-7. Epub 2015 Sep 19. Gastric Cancer. 2016. PMID: 26386561
-
Upregulation of glycogen synthase kinase 3β in human colorectal adenocarcinomas correlates with accumulation of CTNNB1.Clin Colorectal Cancer. 2011 Mar 1;10(1):30-6. doi: 10.3816/CCC.2011.n.004. Clin Colorectal Cancer. 2011. PMID: 21609933
Cited by
-
A Network Pharmacology Study Based on the Mechanism of Citri Reticulatae Pericarpium-Pinelliae Rhizoma in the Treatment of Gastric Cancer.Evid Based Complement Alternat Med. 2021 Apr 16;2021:6667560. doi: 10.1155/2021/6667560. eCollection 2021. Evid Based Complement Alternat Med. 2021. PMID: 33953786 Free PMC article.
-
Molecular characteristics of residual cancer and stromal cells after chemoradiotherapy for gastric cancer: report of four cases.Clin Case Rep. 2014 Oct;2(5):165-72. doi: 10.1002/ccr3.68. Epub 2014 Jun 4. Clin Case Rep. 2014. PMID: 25614804 Free PMC article.
-
CCDC65 as a new potential tumor suppressor induced by metformin inhibits activation of AKT1 via ubiquitination of ENO1 in gastric cancer.Theranostics. 2021 Jul 13;11(16):8112-8128. doi: 10.7150/thno.54961. eCollection 2021. Theranostics. 2021. PMID: 34335983 Free PMC article.
-
Identification and validation of a prognostic 9-genes expression signature for gastric cancer.Oncotarget. 2017 May 10;8(43):73826-73836. doi: 10.18632/oncotarget.17764. eCollection 2017 Sep 26. Oncotarget. 2017. PMID: 29088749 Free PMC article.
-
Clinical Significance of NOTCH1 and NOTCH2 Expression in Gastric Carcinomas: An Immunohistochemical Study.Front Oncol. 2015 Apr 22;5:94. doi: 10.3389/fonc.2015.00094. eCollection 2015. Front Oncol. 2015. PMID: 25954607 Free PMC article.
References
-
- Lordick F, Siewert JR (2005) Recent advances in multimodal treatment for gastric cancer: a review. Gastric Cancer 8: 78–85. - PubMed
-
- Becker K, Langer R, Reim D, Novotny A, Meyer zum Buschenfelde C, et al. (2011) Significance of histopathological tumor regression after neoadjuvant chemotherapy in gastric adenocarcinomas: a summary of 480 cases. Ann Surg 253: 934–939. - PubMed
-
- Reya T, Morrison SJ, Clarke MF, Weissman IL (2001) Stem cells, cancer, and cancer stem cells. Nature 414: 105–111. - PubMed
-
- O’Brien CA, Kreso A, Jamieson CH (2010) Cancer stem cells and self-renewal. Clin Cancer Res 16: 3113–3120. - PubMed
-
- Clevers H (2011) The cancer stem cell: premises, promises and challenges. Nat Med 17: 313–319. - PubMed
Publication types
MeSH terms
Substances
LinkOut - more resources
Full Text Sources
Medical
Molecular Biology Databases
Miscellaneous
