

Distinct effects of rotenone, 1-methyl-4-phenylpyridinium and 6-hydroxydopamine on cellular bioenergetics and cell death
- PMID: 22970265
- PMCID: PMC3435291
- DOI: 10.1371/journal.pone.0044610
Distinct effects of rotenone, 1-methyl-4-phenylpyridinium and 6-hydroxydopamine on cellular bioenergetics and cell death
Abstract
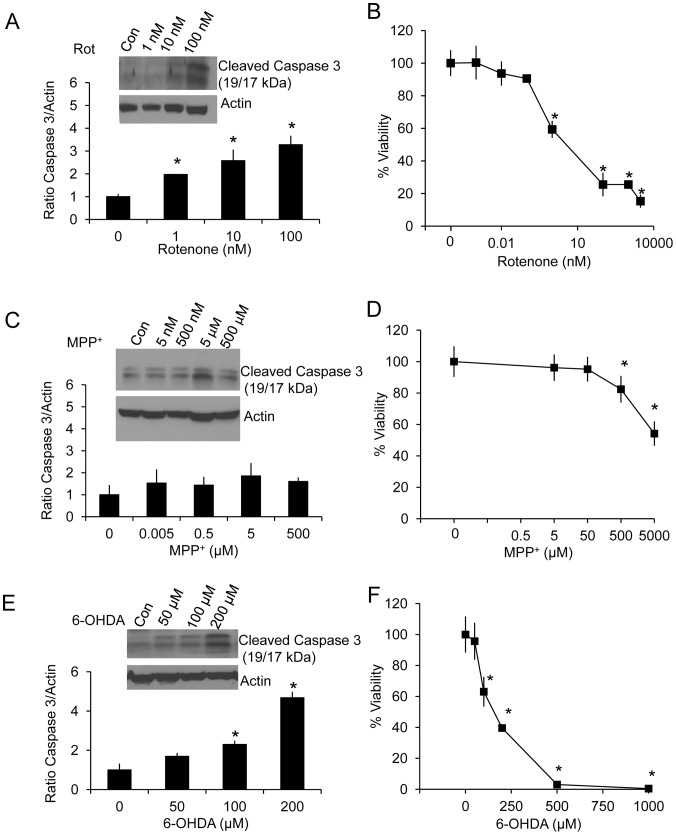
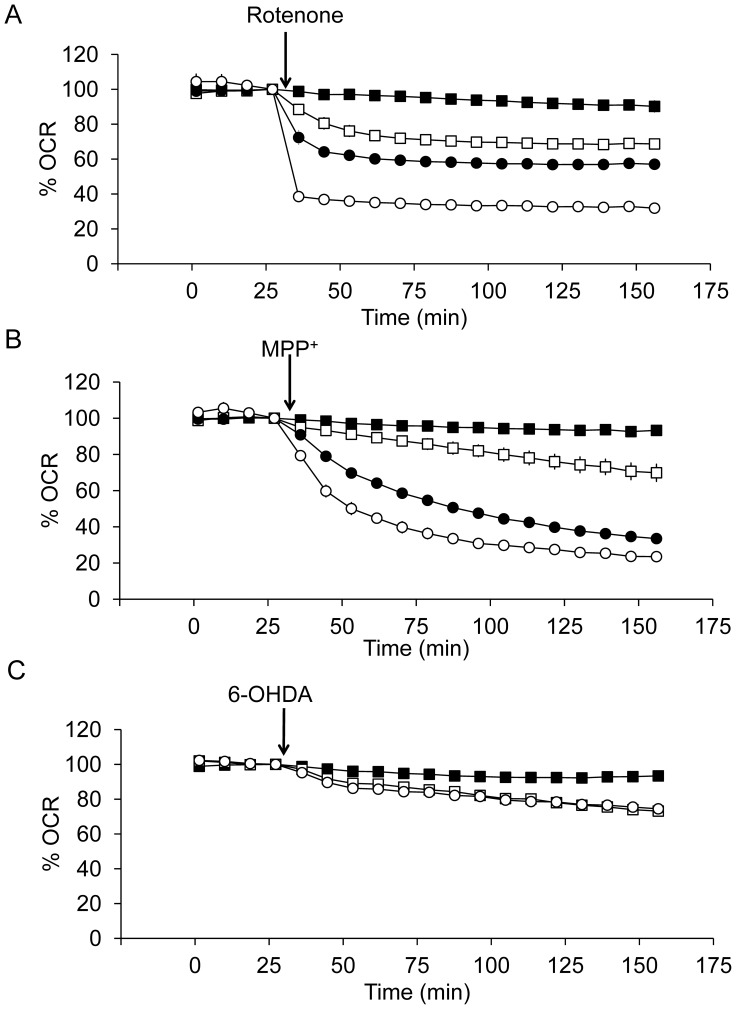
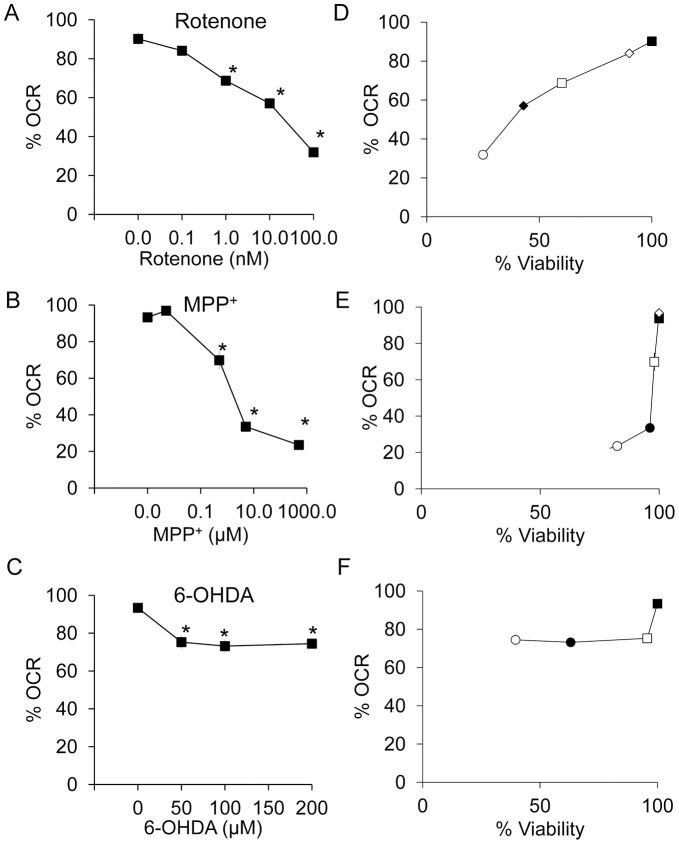
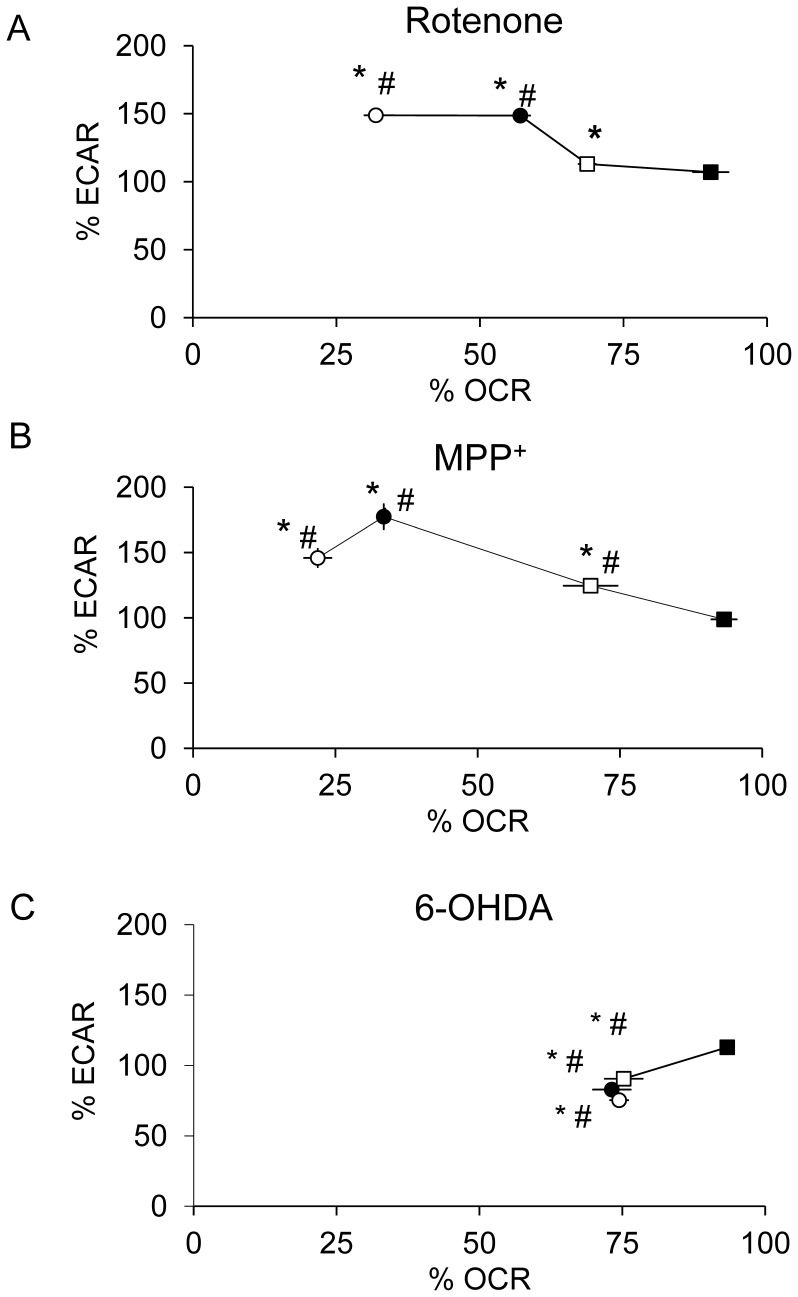
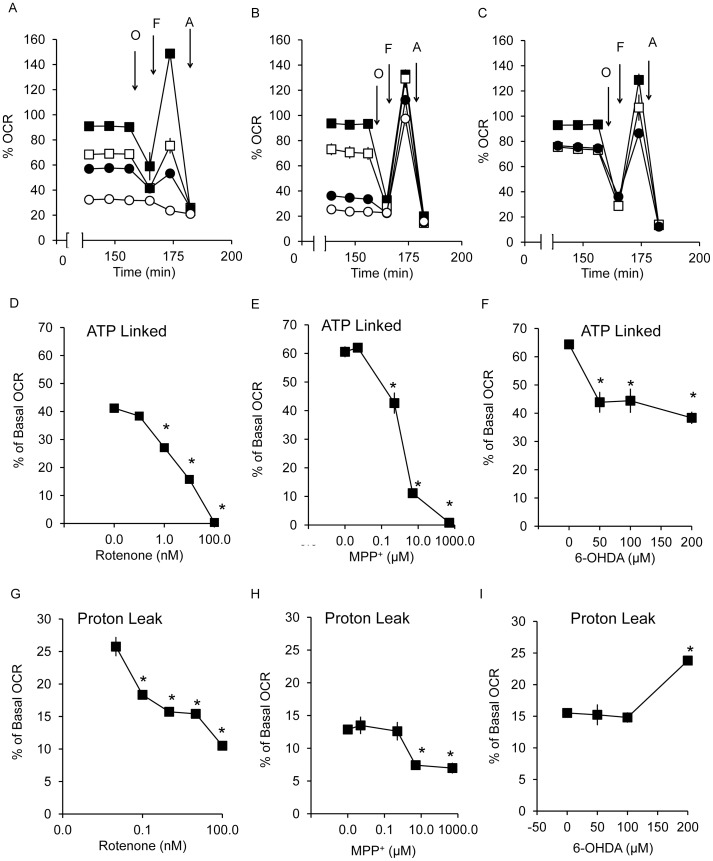
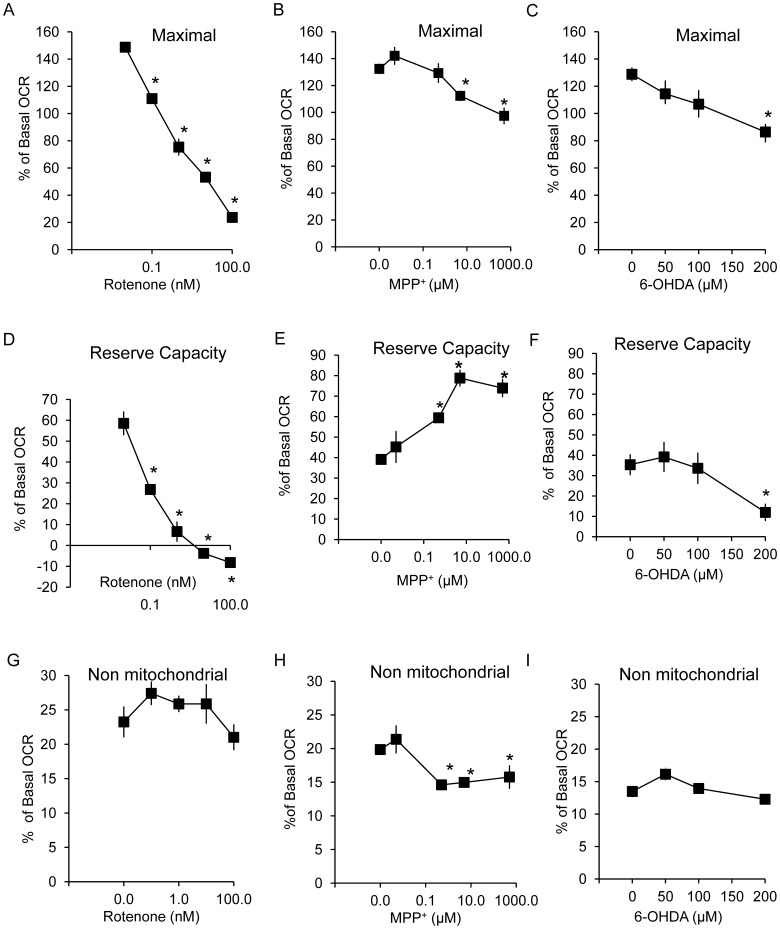
Parkinson's disease is characterized by dopaminergic neurodegeneration and is associated with mitochondrial dysfunction. The bioenergetic susceptibility of dopaminergic neurons to toxins which induce Parkinson's like syndromes in animal models is then of particular interest. For example, rotenone, 1-methyl-4-phenyl-1,2,3,6-tetrahydropyridine (MPTP) and its active metabolite 1-methyl-4-phenylpyridinium (MPP(+)), and 6-hydroxydopamine (6-OHDA), have been shown to induce dopaminergic cell death in vivo and in vitro. Exposure of animals to these compounds induce a range of responses characteristics of Parkinson's disease, including dopaminergic cell death, and Reactive Oxygen Species (ROS) production. Here we test the hypothesis that cellular bioenergetic dysfunction caused by these compounds correlates with induction of cell death in differentiated dopaminergic neuroblastoma SH-SY5Y cells. At increasing doses, rotenone induced significant cell death accompanied with caspase 3 activation. At these concentrations, rotenone had an immediate inhibition of mitochondrial basal oxygen consumption rate (OCR) concomitant with a decrease of ATP-linked OCR and reserve capacity, as well as a stimulation of glycolysis. MPP(+) exhibited a different behavior with less pronounced cell death at doses that nearly eliminated basal and ATP-linked OCR. Interestingly, MPP(+), unlike rotenone, stimulated bioenergetic reserve capacity. The effects of 6-OHDA on bioenergetic function was markedly less than the effects of rotenone or MPP(+) at cytotoxic doses, suggesting a mechanism largely independent of bioenergetic dysfunction. These studies suggest that these dopaminergic neurotoxins induce cell death through distinct mechanisms and differential effects on cellular bioenergetics.
Conflict of interest statement
Figures
Similar articles
-
Alterations in bioenergetic function induced by Parkinson's disease mimetic compounds: lack of correlation with superoxide generation.J Neurochem. 2012 Sep;122(5):941-51. doi: 10.1111/j.1471-4159.2012.07836.x. Epub 2012 Jul 11. J Neurochem. 2012. PMID: 22708893 Free PMC article.
-
Impairment of Atg5-dependent autophagic flux promotes paraquat- and MPP⁺-induced apoptosis but not rotenone or 6-hydroxydopamine toxicity.Toxicol Sci. 2013 Nov;136(1):166-82. doi: 10.1093/toxsci/kft188. Epub 2013 Aug 31. Toxicol Sci. 2013. PMID: 23997112 Free PMC article.
-
Chrysotoxine, a novel bibenzyl compound selectively antagonizes MPP⁺, but not rotenone, neurotoxicity in dopaminergic SH-SY5Y cells.Neurosci Lett. 2012 Jul 11;521(1):76-81. doi: 10.1016/j.neulet.2012.05.063. Epub 2012 Jun 1. Neurosci Lett. 2012. PMID: 22659498
-
N-methyltetrahydropyridines and pyridinium cations as toxins and comparison with naturally-occurring alkaloids.Food Chem Toxicol. 2016 Nov;97:23-39. doi: 10.1016/j.fct.2016.08.009. Epub 2016 Aug 11. Food Chem Toxicol. 2016. PMID: 27523294 Review.
-
Controversies on new animal models of Parkinson's disease pro and con: the rotenone model of Parkinson's disease (PD).J Neural Transm Suppl. 2006;(70):273-6. J Neural Transm Suppl. 2006. PMID: 17017541 Review.
Cited by
-
A transition to degeneration triggered by oxidative stress in degenerative disorders.Mol Psychiatry. 2021 Mar;26(3):736-746. doi: 10.1038/s41380-020-00943-9. Epub 2020 Nov 6. Mol Psychiatry. 2021. PMID: 33159186 Free PMC article. Review.
-
Bioenergetic adaptation in response to autophagy regulators during rotenone exposure.J Neurochem. 2014 Dec;131(5):625-33. doi: 10.1111/jnc.12844. Epub 2014 Aug 21. J Neurochem. 2014. PMID: 25081478 Free PMC article.
-
Inhibition of Protein Ubiquitination by Paraquat and 1-Methyl-4-Phenylpyridinium Impairs Ubiquitin-Dependent Protein Degradation Pathways.Mol Neurobiol. 2016 Oct;53(8):5229-51. doi: 10.1007/s12035-015-9414-9. Epub 2015 Sep 26. Mol Neurobiol. 2016. PMID: 26409479 Free PMC article.
-
Mitochondrial Metabolism as Target of the Neuroprotective Role of Erythropoietin in Parkinson's Disease.Antioxidants (Basel). 2021 Jan 15;10(1):121. doi: 10.3390/antiox10010121. Antioxidants (Basel). 2021. PMID: 33467745 Free PMC article.
-
New molecular mechanisms to explain the neuroprotective effects of insulin-like growth factor II in a cellular model of Parkinson's disease.J Adv Res. 2025 Jan;67:349-359. doi: 10.1016/j.jare.2024.01.036. Epub 2024 Feb 8. J Adv Res. 2025. PMID: 38341032 Free PMC article.
References
Publication types
MeSH terms
Substances
Grants and funding
LinkOut - more resources
Full Text Sources
Research Materials
